Your cart is currently empty!

While in article Build a Business Process Management System – Stage of System Building we have defined that the 1st stage of building a system is Modeling, in article Build a Business Process Management System – BFs-WAITER Pivot Table we have further named the content or directions that we should included in the Modeling stage as BFs-WAITER.
No matter how comprehensive the model can reflect the intricacies of the real world, we should have a tool to effectively transform the model to an executable system with a human interface, namely bGraph in Diamond Digital Marketing Group. Before we dive into the functionality of the bGraph, in order to sharpen the effectiveness of the it, it is always a good practice to enumerate the problem patterns that we encountered when using traditional tools.
In the very beginning of a Modeling Stage, the Business Analyst (or Consultant, whatever you name it) will conduct an interview to the stakeholders of the target company in order to collect the information relating to the target business process. Any kind of documentation collection, verbal description, or even on front line field observation is carried out by the Business Analyst to be familiar with the target business process.
After the Business Analyst finished the interview, he/she should spend time on organising the data into information and pass it to the System Analyst (and his/her programmer team) and bring the BPM System Building stage to Stage 2 (Standardization).
However, different target businesses, different Business Analysts or different clients, will always use different wording or language to describe the same concept. For example, while the client will refer to the product they are selling as Product, Business Analyst will name the Product as SKU. Another example is that the wording Last Name is a synonym of Surname, which can be used interchangeably.
On the contrary, Business Analyst and Client will use the same wording to refer to different business concepts. One of a typical example is the term “Client“. In a manufacturing industrial chain, no matter if you are the Manufacturer, Distributor or the Retailer ,you will always name your downstream as “Client”. During a BPM System Interview, a Business Analyst needs to pay double attention to figure out who (Manufacturer, Distributor or Retailer) the term “Client” is referred to. As a professional Business Analyst, we will name them as the Brand, the Merchant , the Retailer and the End User respectively in order to uniquely identify them.
This polymorphism in communication not only occurs between the Client and Business Analyst, but also the Business Analyst and the Programmers. The more different wordings are used , the more resistance will be derived during the communication.
Therefore , a communication protocol which can synchronise the wording is necessary.
No matter which industry , country or business model the client is in, a CRM system will always share some common properties and features.
For example, the client will expect a standard CRM to have a Contact
module which at least has First Name
and Last Name
as the properties of the object Contact
.
As a Business Analyst , in a BPM System Interview, you may not want to waste both you and your client’s time to go through what common properties a CRM System should have, which those common properties may properly went through many times in the previous similar project.
On top of it, it is a must for a CRM to have a Country
field for the users to fill in the nationality of the client. As a Business Analyst, you may not want to go through the comprehensive list of countries again and again in different projects.
In this sense, it will be a great time saver if we can have a CRM System Building Template which comprises all the common properties of a standard CRM.
Even though you (as a Business Analyst) are driven by public-spiritedness that you already encapsulated a comprehensive Country list as an array for next project use, how can the other Business Analyst , or even the future yourself, remember or realize that you have already created the Country List before?
Even worse, the concept Country
can and will occur not only in CRM , but also almost any kinds of system like Project Management System, Eshop or Booking system. What will make (i.e. trigger) the programmer who is going to build a Booking system think that he can refer to the previously built CRM system to find out the Country List? If he/she cannot realize that a Country list already existed in some other project blueprint , he/she may probably will spend time to do it again, what duplicated the cost of development.
If the next Business Analyst does not realize that you have already done this before, he will not search for the Country List. There is always a gap between searching for the solution and the solution itself.
Although there are many properties in common in a CRM system, there are different properties too. For example, while a trading company may expect a Contact
is defined as a Company or Organisation which should have Company Name
field, a Beauty salon may expect all their Contact
is an individual which should have First Name
and Last Name
field.
It is necessary for us (Diamond Digital Marketing Group) to have a system which stores all the common and differences of building different systems for different clients.
To continue the example of CRM system building, as a Business Analyst, even though you have carefully listened to your client and clearly defined the common and different fields of the target CRM system after the 1st interview, it is very unlikely that you can hit a home run to gather 100% of the expected features and properties of the target CRM system in the 1st interview. While a system building is a lengthy project which always lasts for months or even years, the business environment is probably changed from time to time during the target CRM system building period, which will also affect the features and properties of the target CRM system.
Imagine a scenario as below:
In Day 1 the Business Analyst suggested the field First Name
and Last Name
to be included in the Contact
Module of the target CRM system. In the very next Day 2 , the programmers have already kicked off the program coding workload and created a Table in the Database , as well as the First Name
and Last Name
Field in the user interface.
However, in Day 3 due to a new Marketing Manager (a “she”) on board from the client side, she perceived that the fields Maiden Name
and Middle Name
are common sense and should also be added into the Contact
Module. While she passed this request to our Business Analyst, and then our Business Analyst passed this request to the programmers on Day 5 by directly appending 2 New Columns Maiden Name and Middle Name in the CRM system Building Blueprint Spreadsheet.
This behavior will make the programmers confused because (if you have paid attention to our story) the programmers had already completed the program coding workload in Day 2, how can they realize that 2 new columns are appended to the CRM system blueprint spreadsheet which they had just brought to coding?
Even though you may suggest that the Business Analyst can notice the programmers after they had done any adjustment in the blueprint spreadsheet, due to the fact that the specification of the blueprint is in fact under a streaming status which can be and will be changed from time to time, it will be impossible for the programmers to build the system based on a ever changing blueprint. Do you expect the programmers to click if there is any modification in the blueprint spreadsheet every 1 hour?
In this sense, a streaming oriented system blueprint is necessary for the communication between the Business Analyst and the Programmers, instead of a traditional system building blueprint which only reflects an instantaneous time spot.
This streaming oriented communication mechanism not only satisfies the modification need during the development status, under a DevOps concept, but also in the future after the system is brought to production due to the fact that the system is a living organism which is dynamic to the ever changing business environment. The traditional Batch (or Versioning) oriented can not satisfy in this sense.
As an experienced Business Analyst , you can imagine that no matter how you ask your client to submit an expected new field or new feature of a system via a submission form, the client may probably not follow your instruction and simply send that expected new field to you via email or even WhatsApp.
After you receive the request from the client, instead of only simply forwarding the request to the programmer to handle, as a responsible and professional Business Analyst , it is our duty to validate whether or not the new request is a valid request (most of the time the request is invalid).
For example, if the Client complains in the Contact module of a CRM that the field Sex
is missing in the Form in the user interface, you should first of all go to the project blueprint to check whether the field Sex
should be included in the blueprint. If the Sex
field can be found in the blueprint but not in the Form
in the user interface, then you should contact the programmer to fix it up. But in the real world, most of the time after you conduct the checking, you will realize that the field Sex
is in fact named as Gender
in the Form
in the user interface of the Contact
module.
Can you imagine this kind of back and forth checking and non productive communication is the main cause of eroding the time on production.
Think about if you are handling 10 BPM system building projects on hand , how can you quickly open a system (if there is any!) in your mobile device to check whether the complaint from one client is valid or not? If the complaint is valid , how can you quickly send an instruction to the programmer to fix the bug, provided that you are not seated in front of the desktop but instead on the way travelling to the next client meeting?
If you find the complaint is valid and is a critical path of the project which if you don’t fix up the bug immediately the error will cascade to the next node of the critical path of the project which in turn derives an irreversible catastro, you cannot afford to notify the programmer after you finished the meeting.
A powerful steaming BPM building system is necessary for catering all the mobility needs of the communication.
Pivot Table is a feature which you can usually see in the Google Spreadsheet and Microsoft Excel. While alots of people can address it existence, seldom people can explain what it is and what it’s difference between the normal table. In this article, we are going to break it down and elaborate it in detail with illustration.
It is a good to start explaining what is Pivot Table by a normal Table.
Month | Sales Turnover (USD$) | Salesperson |
---|---|---|
Jan | 5,000 | Anna |
Feb | 2,000 | Anna |
Feb | 3,000 | Angela |
Mar | 1,000 | Ann |
You will not feel strange about the tabular data pattern which a normal table brings to you. In this Normal Sales Turnover Table, you can easily get 5 piece of information because there 5 records inside the table.
The information, i.e. the 5 records, are in atomic level which means that they are already deintegrated into smallest granularity that if you further break down the record, say breaking down from information per Record to information per Cell, you no longer can get the useful information because it will be meaningless if you only know the value “Anna” without knowing what Month and how much Sales Turnover she get. In summary, a Record is the atomic level of a normal Table.
This “Tree View” of a normal Table is good for recording due to the fact that each record can be input separately without affecting the meaning and usefulness of each other. For example, it is totally fine that there is missing information of March Sales Turnover from Joan if you are only interested in the February result of Anna.
However, it is not good for “Forest View” when you want to see the consolidated result of the Sales Turnover Report. How about if you want to know the Total Sales Turnover Amount from Anna? Of course you can do the calculation by yourself each time you want to know the Total amount. But what if there are 10 million records?
Besides, the normal Table only tells you what you can see , it does not tell you what you cannot see. For example, what if I want to know the Sales Turnover of Joan in Jan ? “No Value (or Null)” is also a valuable information that you want to know.
Now, let’s see how we turn the Normal Table into a Pivot Table.
Jan | Feb | Mar | Total by Salesperson | |
Angela | 3,000 | 3,000 | ||
Ann | 1,000 | 1,000 | ||
Anna | 5,000 | 2,000 | 7,000 | |
Total by Month | 5,000 | 5,000 | 1,000 |
In the Pivot Table , now not only you can see the consolidated total amount in terms of Month or Salesperson, but also can easily address the Cell with missing value.
It’s glad to know, but still not impressive enough.
Because in the previous example, it we only use 2 parameters (i.e. Month and Salesperson) to co-ordinate a value (i.e. Sales Turnover Amount). How about if you want to add an additional parameter , for example, Product ?
Month | Sales Turnover (USD$) | Salesperson | Product |
---|---|---|---|
Jan | 5,000 | Anna | Apple |
Feb | 2,000 | Anna | Banana |
Feb | 3,000 | Angela | Cherry |
Mar | 1,000 | Ann | Dragonfruit |
While there is no big different in terms of the look and feel of the table except the additional 1 column added in the very right of the Normal Table, you can compare it with the new Pivot Table which added the Product parameter in below:
Salesperson | Product | Jan | Feb | Mar |
Angela | Cherry | 3,000 | ||
Ann | Dragonfruit | 1,000 | ||
Anna | Apple | 5,000 | ||
Banana | 2,000 |
Same as the Normal Table, an additional column Product is added immediately after the column Salesperson. And most important is that the Value Anna is shown only 1 time instead of 2 times (in Normal Table) due to the fact that the Pivot Table helps to “consolidate” the data to make it minimal.
While in the previous Pivot Table example there is the Total Amount , I skipped this information because it is not the focus on the essense of the Pivot Table. Feel free add the Total Amount any time you want to create a Pivot Table via using Google Spreadsheet ,Microsoft Excel or any Tabular tools.
Now by referring to this Pivot Table , you can answer the question from your boss like:
What is the performance of each Salesperson so far ?
You can sense that the focus is on the Salesperson which the boss probably wants to decide the quarterly bonus based on the performance of each Salesperson.
How about if the boss wants to see the profitability of his/her business? He may probably ask:
What is the performance of each month since the beginning of the year?
Apple | Banana | Cherry | Dragonfruit | |
Month | Anna | Anna | Angela | Ann |
Jan | 5,000 | |||
Feb | 2,000 | 3,000 | ||
Mar | 1,000 |
Due to the fact that the focus of the question shifted from Salesperson to Month, we then put the parameter Month as the name of the row to present as the focus of the table. We name this action as pivot by Month. Compared with the previous Pivot Table which is pivoted by Salesperson, you can find that the name of the Salesperson Anna shows twice this time. Because as we want to consolidate the data of Month (i.e. pivot by Month), we can only sacrifice the neatness of the Salesperson.
The term “Pivot” means whenever you want to rotate any one of the axises from 3 axises (for example), you need to use 1 axis to rely on. The axis you relied on is called the Pivot, while the axis is referring to the columns (or parameters, or dimensions , whatever you name it) in a normal Table. While in the physical world there can only be a maximum of 3 axises , you can add as infinity number of axises as you wish in logical world.
Pivot Table is good for presentation and bad for atomic level recording. If you start recording by applying the data schema of the Pivot Table, you will realise that if you try to insert the value of the table like what “Sales Turnover Pivot Table (Salesperson , Product , Month) , pivot by Salesperson” Table did previously, eventually you will have some missing value in the cell of the row’s name. Besides, the Pivot Table can never serve the function of data processing in turns of filtering and sorting.
Even worse, the client , including your boss, would like to derive different views for different scenarios in different periods of time. If you directly record the data in Pivot Table format, you will soon realise that whenever the client wants to change the pivot of the Pivot Table, say based on Month instead of based on Product, your previous effort on typing in the value , will be in vain. Therefore:
Use Normal Table format to record
Use Pivot Table format to present
A Business Process Management System (BPMS) is a platform (normally a SaaS) that manages and automates well-defined business processes. It creates an infrastructure that enhances company agility, making work faster and easier. BPM involves modeling, automation, execution, control, measurement, and optimization of business activity flows to support enterprise goals across systems, employees, customers, and partners. CRM , Booking System, Human Resource Management System , can all be regarded as part of the Business Process Management System.
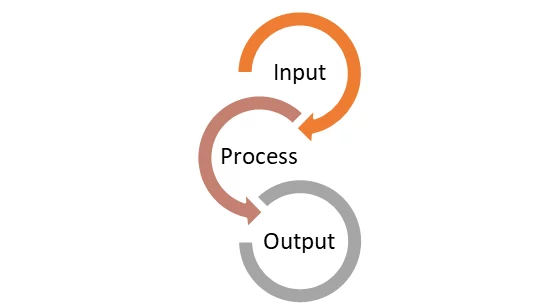
As Murphy’s Law stated , “when something can happen, it will happen”. Whenever there is an inconsistent business process, there is a chance of risk, no matter how little the chance is , as long as you tried enough times, the risk will finally be suffered. As a enterprenuer who run a business, Risk is the synonym of Cost which we should avoid. To standize the Business Process of a business means whenever you provide a same quantity and quality of input, the output of that Business Process will always be the same. This is one of the reasons why a Business Process Management System should exist.
Imagine you are requested from your superior that you have to deliver a Weekly Sales Report to your superior from different platforms including Shopify and Woocommerce. Due to the fact that these 2 platforms are not synchronised and you have to copy and paste the data from the Sales Report from these 2 platforms and consolidate the 2 reports into one and deliver them to your superior. In fact this is a monotonous and trivial data process that in fact brings little value to the company. But it’s inevitable for you to carry out the Task.
Imagine how much time can be saved if there is a system which can be scheduled and automatically synchronise the data from different data sources and consolidate them into 1 report.
This is the reason why a Business Process Management System should exist in order to automate the work process and bring us better life.
Do you have the experience that when your company is using a Google (or Excel) Spreadsheet as a CRM which you are responsible to update the record of the clients based on some event triggers , including
While there may be 50 columns in one Google Spreadsheet for each record of a client, each Event may only require you to modify a particular column (i.e. not all columns).
However, there will be a very long learning curve to memorise the mapping between the 50 columns and the 3 Events.
Even worse, you will never know the sequence of filling in 10 columns for a particular event.
For example, you may never know you need to fill in the Birthday Field in the CRM before there is a Birthday Coupon shown in the drop down list of the Available Coupon list.
By using a Business Process Management (BPM) System, we can set the conditional logic inside the BPM so that the frontend interface of the system will always guide you what to do next, and hide any fields or buttons that are not suitable for your next move, which can significantly eliminate the time of learning the frontend interface.
Have you had the experience that a single Google Spreadsheet is acting as a Client CRM which is shared by 10 Salesperson and 4 departments?
Whenever one sales person is using the Spreadsheet , he may probably apply a record filter so that he only filters the records that are related to him.
Meanwhile, if another sales person wants to use the same Spreadsheet, he may need to deactivate the filters applied by the previous sales person , which means the Spreadsheet cannot be used at the same time by 2 people.
Even worse, if there are 50 columns in the same Spreadsheet. And you can imagine that not all columns are related to all columns.
For example , the Date of Birth field may not be relevant to the Warehouse department which is only responsible for inbound and outbound sales order.
When one of the staff mistakenly erases the value of a field, no one will have any idea who damages the Spreadsheet and makes the Hygiene Spreadsheet never be good.
In order to build a Business Process Management System, following stacks should be considered: