Tag: bGraph

  • Data Schema of Relational Table Importing to Graph Database – Dimensionality

    Definition


    Relational Table

    The Table is the fundamental components inside a Relational Database which stores data in tabular format using Column and Row to coordinate a specific Value (i.e. the Cell). Form and Table (i.e. Tabular format) are everywhere in your daily life.

    Data Schema in Relational Database

    A data schema in a Relational Database is a blueprint or structure that defines how data is organized, stored, and related within the database. It describes the database’s logical design and covering when and what to create Table, Columns , Index, Contraints, Relationship and Data Type inside a Table in a Relational Database

    Graph Database

    A graph database is a type of database that uses graph structures to represent and store data. Instead of organizing data into rows and columns like relational databases, graph databases focus on relationships and connections between data points.


    Objective of Importing Data From Relational Table to Graph Database

    While Graph Database can be acting as the Enterprise Knowledge Base which can speed up the learning curve of both staff and client , how to import the data into the Graph Database is a challenge. 

    As data with Tabular format is dominant in the world, it is inevitable for us to import data from a Relational Database to a Graph Database. There are few ways that we can import the data into the graph database:

    1. Directly coding by Cypher Cypher is a Graph Query Language , as if the SQL in relational database
    2. Import both the data schema (i.e. the metadata. E.g. datatype, column constraint) and the business data (i.e. a normal record inside a table in a relational database) directly from the relational database)

    While graph databases are not common in the general public, it seems that both of the methods required some kind of expertise in order to get the job done. Besides, the methods above are good for batch importing. If you want to import the data in piecemeal, it is not handy.

    It is necessary to have a normal input Form (just like the Form you can see every day in your life) which has zero learning curve for the user to import the data manually into the graph database.


    Data Types

    The wording “Data Type” has a different meaning. it can be referring to the description of the data format , e.g. a column in a Form which can only input a value of Integer , decimal ,text, or a autonumber. 

    Instead, Data Type has another meaning which is used to classify data as Business Data, Metadata and Model Data. For details about the difference between the 3 , it is strongly recommended you to read the article bGraph Architecture – Model Data beforehand.

    The focus of this article is for catering the latter.


    Interpreting Relational and Graph Database in a Dimensional Perspective

    Before we dive into the problem pattern and its paired solution on importing the data from a relational table into a graph database, the concept of interpreting data in terms of dimension is crucial for us to understand what and why we are solving the problem in the way we did.

    What is Dimension

    By definition, In physics, a Dimension is a space that can be measured and extended. For example:

    Dimension (x-D)Example of UnitExample in Reality
    0-DN/Aa point (or a Spot)
    1-Dcma Line
    2-Dcm2a Plane (or an Area)
    3-Dcm3a Volume
    4-DHourTime
    5-D????

    Relationship Between Dimension and Vector

    A practical purpose of the concept “Dimension” is to coordinate something. 

    For example, can you tell me where the alphabet “A” is in the Line below?

    ______A___

    While the “A” is definitely not in the middle, it is not in the starting or ending point of the line either. You can say it is right-stewed , but cannot exactly tell.

    How about now?

    123456A89

    Now you can confidently say that the “A” is located in the position “7” of this 9-unit-long Line.

    The Line is regarded as “1 dimension” because you can measure the length of the line (1-9) in width (and only width) , but not in height or in depth or in time. 

    DimensionCo-ordinate of Data Point Example
    0-DN/A
    1-D{1}
    2-D{1,2}
    3-D{1,2,8}
    4-D{1,2,8,10}

    So it is quite easy to understand that the amount (or you can say the “digit”) of data points is exactly the same as the degree of dimension. Whenever you want to coordinate an additional dimension, simply add an additional data point (i.e. the digit) into the array.

    In mathematics , we call this long number and extensible array (e.g. {1,2,8,10}) as Vector, which is the concept under the mathematics branch of Linear Algebra

    While as a human being we cannot imagine a material object in a 5-D physical world, there is no limitation on how many dimensions you can add in mathematical world.  In fact , you can add 100 , 1,000 or 10,000 data points into the Vector if needed, as long as you can think of the use case (e.g. to coordinate something) and provided that you have sufficient computing power to do the vector calculation and operation.

    That’s the reason why even the Graph Theory coined almost 300 years before, and computer existed almost 90 years, we still didn’t hear of Graph Database until this 1 or 2 decades (may be because you were not even born!) due to the limitation of the computational power and infrastructure.


    Relationship Between Dimension and Database


    0-Dimension in Database

    As mentioned before, the main purpose of a Vector is to coordinate a data point. In fact , coordinating something is the initial step of “Searching”. 

    What is the benchmark of whether we can successfully coordinate something mostly depends on whether the coordination can refer to one and only one outcome (i.e. singleton) 

    Allow me to start with an example based on 2023 Barbie film.


    Imagine in a country ,Barbie Land, Barbie1 is the one and only one citizen. To record Barbie as the citizen of this country (most likely Barbie will be the one who carries out this recording task!), Barbie can simply record like below:

    Barbie

    That is!

    While there is one and only one citizen in this country, every time anyone talk about “Barbie” in this country, the word “Barbie” can uniquely identity the material substance of the person who is referring to , which means it can perfectly and good enough to “coordinate” the one and only one material substance citizen “Barbie” in Barbie Land.

    You can regard this “Cell” as 0-Dimension because there is one and only one value, and there is no any direction for you to extend horizontally or vertically. (Remember the definition of Dimension?)

    0-Dimension : In terms of Data Structure, only one and only one Cell which stored the Value.


    1-Dimension

    When someone outside Barbie describes Barbie, he/she may say that Barbie is 29 cm height , the citizen of Barbie Land. If height = 29cm , citizenship = Barbie Land, then X = Barbie , what is the “X”?

    Obviously the X = Name.

    In order to faciliate others to describe the material substance object (i.e. Barbie herself), we can add an additional Cell on top of the Cell Barbie as below.

    By applying the definition of Dimension, you can realize that the Cell (i.e. 0-Dimension) had been added an additional Cell Name and turn it to a vertical line (i.e. a Column). Therefore, the data structure had been transformed from 0-Dimension to 1-Dimension.

    From Now on , you can call this data structure as Column.

    1-Dimension : In terms of Data Structure, when a “Column Name” is appended on top of the 0-Dimension Cell, it can be regarded as 1-Dimension.


    2-Dimension

    One day, when Barbie experienced the imprefection of herself , she realized that she is in fact only a stereotype. She therefore gave herself a Last Name as below:

    First NameLast Name
    BarbieStereotypical

    When a column Last Name is added, the word “Name” is not enough to differentiate between the two. And to uniquely identify the two , the “First” and “Last” are added in front of the “Name”. 

     
    You may find the pattern that whenever you want to uniquely identify some objects, simply attach some attributes (e.g. Last Name) to that object, in order to let the Name refers to one and only one instance. (This is the definition of the word “Definition”!)

    Back to our database use case, as now an additional Column is attached to Barbie, you can see the data structure is in fact extended from a Column (1-Dimension) to a Plane (2-Dimension). If you remember the vector example, you can write it the vector as {Barbie, Stereotypical} .

    From now on, you can call this Plane as Table.

    2-Dimension : In terms of data structure, whenever there are 2 columns with a Column Name and 1 Record, it can be regarded as 2-Dimension.


    Adding a New Record in 2-Dimension

    As time goes by, the population of the Barbie Land increased 100% from 1 person to 2 people , of which the newbie is also named Barbie.

    First NameLast Name
    BarbieStereotypical
    BarbieWeird

    Applying the same logic of the definition of Dimension, although an additional record , i.e. Barbie Weird, is appended to the list, the data structure is still in 2-Dimension as the new record by itself does not extend to any new direction. (it extended vertically which this direction already existed before.) That means no matter how many records you added, the Table is still in 2-Dimension.


    Adding a New Column in 2-Dimension

    Although logically anyone can classify 2 Barbies with different First Name and Last Name, in reality as the 2 Barbies will not seal their name in their forehead, there is no way to teach a person who never see them before to differentiate between the two.

    Having discussed with this problem, in order to uniquely identify themselves visually, the 2 Barbies agreed to give a Hair Style describe to themslves as below:

    In this case, a obversable character is needed to enrich the data structure, letting the information inside the data structure more close to the reality.

    First NameLast NameHair Style
    BarbieStereotypicalFloating
    BarbieWeirdQuirky

    Applying the same logic of the definition of Dimension, although an additional column , i.e. Hair Style, is appended to the Table, the data structure is still in 2-Dimension as the new Column by itself does not extend to any new direction. (it extended horizontally which this direction already existed before.) That means no matter how many Columns you added, the Tabel is still in 2-Dimension.


    3-Dimension

    It seems the 2-Dimension Table can describe the reality of the Barbie Land well until both Barbies want to create a sunglasses list which can help her to manage all your eyewear in their wardrobe.

    After hours of effort , they created the sunglasses list as below:

    As a new Data Table is created, here raised another question : How to uniquely identitiy the 2 Tables during communication?

    Well, as you can think of, simply giving the name to each of the 2 Tables can solve the problem.

    Sunglasses#Sunglasses StyleSunglasses Frame Color
    S01Cat-Eye FrameOrange
    S02AviatorDeep Blue
    S03SportySilver

    Therefore, Stereotypical Barbie name the 2 Tables as Citizenand Sunglassesrespectively.

    Same as your life, the 2 barbies just open a can of worms. While both Citizenand Sunglasses by itself are 2-dimension objects (i.e. a Table), listing out 2 Tables , referring to the definition of Dimension,  will create another new Dimension (2 Tables are definitely measurable and you can extend as many objects (i.e. Tables) as you want in the same direction).

    And therefore, a 3-Dimension data structure is just born! Now you can call this 3-Dimension data structure as Database.


    Testing The Theory From 1 to 3 Dimension

    It’s time for us to take a deep breath before we dive into the 4-Dimension data world. Limited by the human brain’s structure, any dimension higher than 3 will be hard to visualise and project in our brain. Therefore we have to make sure we are acquainted with the 0-3 Dimension concepts well.

    The next question is, how do we prove that our 0-3 Dimension data structure theory is correct and practical?

    Let us back to the basics of why we have to build the data structure. This is the fundamental objective of the information system. The logic is as below:

    1. Making decision will bring value in the real world
    2. Decision Making Quality affects the value of Decision Making.
    3. Accurate, timely and relevant Information will facilitate the Decision Making Quality.
    4. Information is refined from how we analyze and process (e.g. egress, load and transfer) the Data in the Database.
    5. The Data stored in the Database is classified as Descriptive Data and Inferential Data.
    6. Descriptive Data is from Real World Observation.
    7. Inferential Data is the product of both Descriptive Data and Intelligent (i.e. how we analyse the data, for example using logistic regression model to classify the Descriptive Data). 

    To streamline the deduction steps above, you can conclude that the purpose of the Information System is that the user of that Information System (i.e. the Database) can simply make the decision by observing the world, leaving all the processing and analysing steps to the Information System. 

    And hence, whether or not the database is competent or not depends on whether the data stored can reflect the reality in fidelity (i.e. is it descrptive enough) and uniquely identify the underlying objects found with the real world (i.e. co-ordinating) , while leaving the inferential duty to other system. (e.g. an AI facial recognition system)

    It is straightforward that we can test the fidelity of the database by asking simple questions in below:


    Q1: How many citizens are there in Barbie Land?

    A1: Two.

    By counting the number of records (i.e. Row) in the Table Citizen, we can easily figure out there are 2 records in the Table Citizen.

    The 1-Dimension data structure (i.e. any of the Column inside the Table) perfectly performs the task on description the objects in reality, and hence it can be regarded as a competent database.


    Q2: Please describe the citizen in Barbie Land whose last name initialized with “s” ?

    A2: Steretypical Barbie is the citizen in Barbie Land who has a floating hair style.

    By filtering the Last Name column in the Table Citizen , you can easily describe the object (i.e. the record) by finding out its First Name, Last Name and Hair Style. 

    This 2-Dimension data structure (i.e. Database) perfectly performs the task on description and co-ordinating the object in reality, and hence it can be regarded as a competent database.


    Q3: What object types can be found in Baribe Land? and how many instance in each object?

    A3: 2 Citizens and 3 Sunglasses can be found in Barbie Land.

    By enumerating all the Tables inside the Database, we can easily answers the question Q3.

    This 3-Dimension data structure (i.e. Database) perfectly performs the task on description and co-ordinating the object in reality, and hence it can be regarded as a competent database.

    You can see that up to now , the existing 1 to 3-Dimension data structure perfectly answers the 3 questions above, until we start asking another type of questions : 4-Dimension question.


    4-Dimension

    Let’s start the 4-Dimension session with a question and you will realize the limitation of the 3-Dimension data structure.

    Q4: What is the wearing habit of the Citizens in Weekday?

    While we already have the Table Citizen and Sunglasses to record each individual citizen and sunglasses, these 2 Tables do not describe the Relationship between the 2.

    If we tried to record the mix and match wearing observation in existing Tables, no matter which Table (Citizen or Sunglasses) , it will look like this:

    WeekdaySunglasses#Sunglasses StyleSunglasses Frame ColorCitizen
    MondayS01Cat-Eye FrameOrangeStereotypical
    MondayS03SportySilverWeird
    TuesdayS02AviatorDeep BlueWeird
    TuesdayS03SportySilverStereotypical

    The Table above sacrificed the fidelity the reality provided in answer of Q1 (i.e. How many citizens are there in Barbie Land?) as some of the citizen are duplicated in the records such that we cannot simply count the records to answer the question. (i.e. There are 4 records in total but in reality it got only 2 sunglasses and 2 citizens) 

    In order to solve the problem, instead of appending the additional columns into any of the existing Tables , it is a better way to create 2 additional tables – WeekDay Table

    Weekday
    Monday
    Tuesday
    Wednesday
    Thursday
    Friday

    Together with the Mix and Match Table that we just created:

    WeekdaySunglasses#Sunglasses StyleSunglasses Frame ColorCitizen
    MondayS01Cat-Eye FrameOrangeStereotypical
    MondayS03SportySilverWeird
    TuesdayS02AviatorDeep BlueWeird
    TuesdayS03SportySilverStereotypical

    Now there are 4 Tables in Total inside the Database:

    1. Citizen
    2. Sunglasses
    3. Weekday
    4. Mix and Match

    However, when you observe carefully, you can realize that in fact the terms Mix and Match has no records and does not exist in reality. Instead, the concept Mix and Match is a concept (i.e. a Relatoinship) rather than a material substance which can be observed. 

    If you still have no idea what i am talking about, let’s recall the table Citizen that we have created during the 2-Dimension session:

    First NameLast NameHair Style
    BarbieStereotypicalFloating
    BarbieWeirdQuirky

    Can you realize that you cannot exactly find any material substance of “Citizen” inside the Citizen Table? It is because the terms Citizen is a Class , while the 2 Barbies are records are the Instance. There is no material subtance for the term Citizen.

    Same phenomenon happended in other Tables that you can only find the Instance instead of the Class inside the records in any tables.

    If you think this logic make sense and apply to the table Mix and Match , you may now realize that the concept Mix and Match is a Class instead of an Instance which cannot be found inside the record of the Table Mix and Match.

    As we just created a new Class Mix and Match to consolidate all the 3-dimesion Tables Citizen , Sunglasses and Weekend , that means another new Dimenion , 4-Dimension, had been created.

    If we visualize all the relationships of all concepts mentioned throughout the paragraph via the Entity Relationship Diagram, it will become the diagram in below:

    Barbie Land Mix And Match Entity Relationship Diagram
    Barbie Land Mix And Match Entity Relationship Diagram

    4-Dimension+

    So, it is possible that i can build infinity number of Dimensions of the data structure inside the database? Yes, in theory you can. Whenever you cosolidate all the instance in the same Dimenion and form a list, you created a new Dimension.

    As long as you understand how we use the dimensionality in the data structure to describe the real world, we can stop the example in 4-Dimension.


    Conclusion

    In this section we just introduced how we observe and describe the reality and fit them into a Relational Database via a dimensional way, as well as how we create a new dimension by gathering all instance in lower dimension to form a new class in the upper dimension.

    In next article, we are going to address the problems that the Relational Database suffers, and how we fit the Relational Database into the Graph Database to compensate the problems suffered by Relational Database.


    Footnotes

    1. Please refer to the Barbie film 2023 in order understand why we use the name Barbie as an example. ↩
  • What Problem Patterns bGraph Is Going to Solve

    What Problem Patterns bGraph Is Going to Solve

    Introduction

    bGraph is an SaaS developed in-house by Diamond Digital Marketing Group which can be categorised as a GraphRAG web application serving as an Enterprise Knowledge Graph.

    To better understand what GraphRAG exactly is, it is imperative for us to start with a real world problem pattern


    Real World Problem Patterns

    The definition of profit is simply Sales Revenue Minus Cost. While in the legal aspect, an cost item of Labour Cost (e.g. Salary) is good enough to meet the legal duty in terms of financial report, it cannot be in the real world reflects the problem that how the 40 Hours x 4 Weeks working hour for a staff is distributed among different activities throughout his/her daily operation. Instead of presenting the cost in monetary terms, I would like to convert it into Time.

    In almost any industries or any business model we can categorize the types of time cost in below:


    Production Time Cost

    In a service-oriented business, Production Time Cost is simply referring to the time a staff spent on rendering a service to the client. For example, a hair dresser spent 30 minutes on providing hair styling service to the client. This 30 minutes will be categorized as Production Time Cost.

    In a sku-oriented business, Production Time Cost can be categorized as the time on any kinds of labour cost incurred between planning to product delivered to the client. For example, even if you sell a Clock online, not only the Time Cost the Product Manager should be spent on designing and manufacturing the clock, the Customer Service Officer also needs to spend time on answering the enquiries from the wholesale or end-user clients. 

    Communication Time Cost

    Communication Time Cost is indispensable in business world. We can easily find the Communication Time Cost in scenarios below:

    Communication between staff to client

    1. Reporting (e.g. Sales Report, Order History)
    2. Documentation (e.g. Invoice , Quotation, Shipping Note)
    3. Enquiries from Clients

    Communication between staff to staff

    1. Reporting (e.g. Monthly Report)
    2. Knowledge TransferMeeting
      • e.g. In a brainstorm marketing meeting in a digital marketing agency which the salesperson needs to transmit the requirement and the marketing parameters acquired from the client to the marketer team such that the marketer team can formulate a digital marketing strategy based on the input from the salesperson.
    3. Knowledge TransferTraining and Learning
      • e.g. A new staff onboard which he/she can be competent to his/her job duties when time goes by based on below:
        • Operational Manual Reading – 10%
        • Advice from supervisior and teammate – 10%
        • Hands-on practicing – 30%
        • Trial and Error , feedback and complain from supervisior or client – 50%
    4. Knowledge Not Transferred
      • e.g. Imagine 1000 hours had been spent by the staff on designing and developing a new product , system or skill. When the staff quit the organisation, the knowledge that he/she acquired will be left together with him/her if there is lack of knowledge management practice in the organisation.
    5. Communication by Optimisation
      • e.g. A client requested to the web designer that he want the font-size in the website “Bigger”. Whenver the web designer modified the font-size from “12pt” to “24” pt, and then the client responsed that the font-size is “Too Big” this time. So the web designer by trial and error to adjust the font between “12pt to 24pt” a few times, and finally optimized in font “18pt”.
    6. Instruction Placing
      • e.g. An Marketing Director ordered the Marketing Manager in his/her team to prepare for the Consolidated Marketing Report with the followng specifications which is different each time:
        • CTR
        • CPC
        • CPM
        • CPA
        • ROAS

    Searching Time Cost

    Searching Time Cost can be derived from following scenarios:

    1. Bad Naming Convention
      • e.g. a Sales Report File named as “Report.pdf“, which the name in itself cannot differentiate among other reports created in/by different time, purpose and person.
    2. Lack of Indexing
      • e.g. Reinvent a new wheel – A staff spent 20 hours to created a comprehensive operational manual covering all his job duties. However, one day when this staff quit and the new staff does not realize the existence of that operational manual and then he spent another 20 hours to write a new one.
    3. Not Semantic Search Friendly
      • e.g. One staff member created a “Client List” and put it in the company drive , while the user searched “Customer List” in the company drive and then no result came out as he did not realise that he needed to search “Client” instead of “Customer“. After 15 minutes back and forth with different staff, he finally realized that he should search “Customer“.
    4. Lack of centralized data repositary
      • e.g. A Prospect discussed the project with the staff via Personal WhatsApp , WhatsApp group, Email, Phone Call , MS Team Video Meeting and Face to Face Meeting (with minutes). Having also checked with the CRM , Facebook CRM and eDM sending record, the staff spent 1 hour to consolidate all the data into the CRM contact log and let his supervisor review the whole picture before they can decide what to do next for closing a deal.

    Error Handling Time Cost

    Error Time Cost can be derived from following scenarios:

    1. Time Cost on doing wrong thing
      • e.g. Spent 1 hours to go east while it is expected to go west.
    2. Time Cost on undo the wrong step
      • e.g. Spend 1 hours to redo the error and go back to the original starting point.
    3. Insurance cost on monitoring and addressing the error
      • e.g. In order to address the wrong direction as soon as possible , the driver should report to the head office hourly. Besides, each car should install a GPS system (i.e. cost incurred) to trace the real-time position of the car.
    4. Time Cost Ripple EffectError brings New Error
      • e.g. While most of the time in a business world, how to do Step 2 will be dependent on the output of Step 1, and Step 3 dependent to Step 2 , so on and so forth, going wrong in Step 1 will trigger a ripple effect to lead Step 2 and Step 3 all go wrong.
    5. Time cost on Error Identification
      • Imagine you are using WordPress to build a website in which you have installed 100 plugins to make the WordPress website workable. However, after this 100 times installation, an error message came out which made your whole website shut down. You have no idea which plugins cause the error. The only way you can find out the root cause is to deactivate all the 100 plugins and start installing and observing the plugins one by one to see when the error occurs. The more plugins you have , and the more error messages you get, the exponential the error handling time cost will go.

    Research and Development Time Cost

    Error Time Cost can be derived from following scenarios:

    1. System Development
      • e.g. You want to write an operational manual to describe a step by step guideline on how to run the procedure at a hair-dressing salon from client walk-in to client leave after service rendered.
    2. No record on “Dark Matter”
      • e.g. Imagine there is a problem in which your staff have spent 1 day testing out all the 10 possible solutions. Finally you find out there is 1 and only 1 solution that is feasible among the 10. However, the staff quit and he did not record all the 9 remaining “Not Solutions“. A new staff on board and as he wants to improve the existing 1 solution, he starts his research and goes through the other 9 “Not Solutions” again. 

    You can imagine that among all these Time Cost, only a very small portion of Time Cost is observable and measureable. The Time Cost which is not observable and measureable can never be cut or minimized.


    Ways of handling the Time Cost

    There are 3 directions on handling the Time Cost

    Eliminate the Cost Item

    Directly and brutally cut the item derived the cost. For example, streamline the workflow from 10 steps to 9 steps

    Minimize the Cost

    1. By systemizing the workflow to cut the communication and training cost
    2. By automating the workflow to cut the labour cost

    Turn Cost from expenses to assets in nature

    1. Build a do-once-use-many-times system. For example, once you write a Sales Script covering all the possible scenarios from a conversational sales meeting, this Sales Script can be applied to many sales meetings with same types in the future until the underlying environment changed. This kind of time spending , even though it is still a Cost, can be classified as Assets instead of Expenses because this Cost will generate future revenue.

    Applications which can handle all the Problem Patterns

    After years of hands-on experience (this is a black box and don’t ask me how and why I know! Thsi is an human intelligence before artificial intelligence dominates this world), you will realize the application can take 3 steps (or directions , to be precise) to handle all the time costs mentioned above:


    Enumeration

    By observing and modeling the world, you can address the relevant factors , steps, components, concepts that are related to your business.

    For example, when you are running an e-shop, you will realize different kinds of transactional emails or reports which will reflect the reality. This procedure is called Modeling.

    Modeling of an eshop Purchase Cycle:

    1. New User Registration Email
    2. New Order Email
    3. Invoice Email
    4. Receipt Email
    5. Delivery Note Email

    While the concept is easy to understand, it is extremely difficult to execute as you have to decouple each procedure, workflow, and concept into an executable encapsulated module which you can reuse or execute systematically.

    On top of that, it is a challenge for a Business Analyst or System Analyst to observe from the reality to refine the related components which comprehensively describes the model of the business. We called this comprehensive scenario Sample Space.

    For example, while every one will understand the concept “Client”, a Business Analyst have to decouple the concept “Client” based on following attributes in order to make it executable and more close to reality:

    1. User Journey – Prospect vs Client or 1st Time Client vs VIP
    2. Individual Client vs Enterprise Client.

    While the comprehensive option value lists of some of the attributes can easily be enumerated , most of the time most of the option value lists for most of the attributes cannot be enumerated in the time spot in which the system is built. More close to reality is that these option value lists, or even the attributes itselfs, are “growing” organically from time to time instead of being addressed in the very beginning.

    For example, even the option value of attributes Gender can be classified as Male , Female in old days and an additional option value Transgender nowadays.

    Also , what to observe in reality, and whether you think the component is relevant to your business or not highly depends on the level of knowledge of the Business Analyst. For example, in 4-year old you regarded water as water. But in 14-year old you should have realized the water can in fact be further decoupled by 1 H (Hydrogen) and 2 O (Oxygen).

    While we will not dive into the problem patterns that we suffered during the enumration process, enuermation by itself is the very beginning of the GraphRAG based Enterprise Knowledge Graph web application.

    In a techncial stack, we normally have the following technical components to execute the Enumeration process:

    1. Web Scrapper
    2. Public APIs (e.g. Public Facebook Post)
    3. Private Database and APIs (e.g. Company self-host CRM or Inventory System)
    4. UGC – Voice-to-Text conversation log or User submitted Documentations
    5. Modeling Blueprint – Meta Data , Data Schema , Business Lgoic, Compliance and Regulations.

    Indexing

    Indexing is the procedure to facilitate all the things or concepts in the Sample Space to be stored and searchable.

    For example, giving a Sales Order an Order Number (e.g. SO20323) is a common and easy way to “Index” an Sales Activities (and conceptualized via the document Sales Order).

    However, not anything can be easily indexed as simple as a Sales Order.

    While i am not going to dive into the problem patterns we suffered in the indexing procedure, we can in high level describe some of the indexing procedures for a solution application:

    1. Text Embedding to Vector Database – Instead of documentation level, indexing down to the level which is to index every single word written or spoken by a client into a vector database its searchability.
    2. Business Catalog in Data Lake – Indexing the Meta Data (i.e. the data of data, a Column Name of a Table, for example) via different data source (e.g. CRM / eDM / Inventory System / Booking System / e-Shop). For example, after you realized that there is a new option value “Transgender” under the attributes of Gender, you will need to index this new option value.
    3. Data Streaming – instead of indexing every single component in a batch (e.g. once per day), we index the data in real-time instream.

    Mapping

    Mapping is simply to find the relationship between 2 concepts. The challenge task is that you need to address which relationship is relevant to link up among tens of thousands of combinations. For example, when a customer service office asked the client to provide the Client ID# , the client forgot his/her Client ID# and simply provide a mobile phone number for the customer service office to lookup what the Client ID# is.

    In the above example , Client ID# and Client Mobile Phone Number is easy to map due to the fact that most likely that the Client Mobile Phone Number is linked to the Client Table itself. However , this ease does not apply to everything.

    For example, how can you figure out an Facebook Username “BillGates” is in fact referring to the same person in Instagram Username “ThisisBillGates” as they are using different wording to refer to the same object (person)?

    As usual, while we didn’t dive into details, we describe the techncial stack it normally be applied to do the mapping:

    1. Entity Resolution by Graph Database – find out same person with different name or wording under different data source.
    2. Link Preduction by Graph Database – find out the relationship between 2 concepts.
    3. RAG by Human Know-how – while LLMs is well trained by public knowledge domain, there is some domain specific knowledge which is in private , for example , the know-how of a 3-star Michigan chef on how to produce a perfect Risotto. Some sort of merchanism should allow the human to manually map the know-how into the Knowledge Graph Database so that the LLMs can apply its well-trained intelligent into the human know-how knowledge. (i.e. This is what RAG is performing)

    Searching

    Once all the concepts are enumerated and indexed , and the relationship among each concepts (we called it “Node“) are well defined and connected, we can start the Searching step.

    In fact, regardless of industry, job nature, role, task , business model, anything, as long as you ask a question, you are performing a “Search” activity.

    To execute a “Search” is to “Find a Needle (an instance) in Haystack (a pool of instances)”

    For example, when the customer service officer received the an enquiry from the client asking “When my Sales Order Delievered”, he then carry out the steps below:

    1. Get the Client Mobile Phone Number from the Client.
    2. Search (i.e. Lookup) the Client# by the Client Mobile Phone Number
    3. Search (i.e. Lookup) the Sales Odrer# by Client#
    4. Search (i.e. Lookup) the Shipping Record # by Sales Order#
    5. Search the value of the attributes “Shipping Status” and “Expected Delivery Date” inside the Shipping Order record.

    While the previous example is happened in a customer service scenario, the “Search” pattern also happens in the production team.

    In fact the search theory deserves a whole book to elaborate. We will skip the theory and directly highlighted the technical stack that we are going to use to carry out the Search Function:

    1. Search Bar or Chat Bubble – A search bar or Chat Bubble in the frontend interface which let the user to communicate with the system by inserting their search queries or questions.
    2. Semantic Search Engine – A search bar which the user can simply input human daily language , even though the search query is not 100% correct or precise. The Semantic Search Engine can still output some similar result even the search query is not 100% precise.
      • For example, when i search “GA4 Instell Guide” , the Semantic Search Engine will output the “Google Analytics 4 installation and configuration Guide” which connected to our Enterprise Knowledge Graph even thought there is a typo in the word “install” and the “GA4” is the synonyms of “Google Analyitcs 4“. (Although it is a norm in your daily to use Google Search Engine in this manner, don’t take this as granted as you can hardly find this semantic search function the search engine other than Google Search Engine.)
      • Another concept is that people in different role will use different language to refer to the same concept. For example, in a website design project, 3 differents role will use different wording to discuss the font size of the homepage:
        • Client : Please make the word in the title bigger
        • Marketer : Do you want a Font-Size = 20pt?
        • Programmer : I would prefer 1.1 em in order to cater both moble and desktop version.
    3. LLM – An highly intelligent “brain” (e.g. ChatGPT) which can comprehend and understand both the “Needle” and “Haystack” and perform the search and return the related outcome.
    4. LangChain – While LLM (e.g. ChatGPT) is good in understanding the text, in reality we need another AI model to comprehend Image (e.g. a AI model called Llama 3.2). LangChain is used to orchestrate the multimodel to make them work together.
    5. RAG Solution – While renowned LLM (e.g. ChatGPT) is good at understanding all the public domain concepts and knowledge at the time the model was trained, they cannot understand the concepts which are under specific knowledge domain. For example, if your business invented a new product name “aldis lds” , the ChatGPT will not recognize it as a product of your company. RAG is to orchestrate the knowledge of the real world, as well as the specific knowledge you provided before it gives you a search outcome. Please understand that while the business operation or business data may change everyday, the cost of “fine-tune” the LLM every day is simply too time consuming.
    6. GraphRAG – While the RAG which is based on Vector is good in similarity search, if you have zero fault tolerance and want a 100% precise search result which the underlying know-how knowledge domain which is probably only acquainted by yourself (e.g. as a Cloud Architect Consultant). You hope that you can provide some of your know-how in 100% precision to the system by manual input, and let LLM find out the result to the user based on your personal know-how and the understanding of the knowledge in the public domain. Graph Database perform better than Vector Database in terms of hallucination-free.
    7. Adaptive GraphRAG – In old days we learnt from finding the answer. In the era of AI, we learnt by starting at forming a good question. While most of the time the user doesn’t even know what they are asking or searching for. For example, in an interior design consultation meeting, when the client expresses that they want a “japanese style bedroom”, before the designer gives them the answer , he/she will most probably ask the client “what is your budget” or “is it Ancient Japan or contemporary Japan” . You can realize that the question should be “adaptive” (i.e. keep optimising and adjusting) before the useful question is formed. An answer from an meaningless question is expected to be meaningless.

    In conclusion, the GraphRAG SaaS Enterprise Knowledge Graph We Application is a solution backed by Enumeration, Indexing and Search functions which can help any individual or organisation to save time on Production , Searching , Error Handling and Communication cost.


    Real World Scenario

    In order to visualize the power of the GraphRAG Enterprise Knowledge Graph, allow me to demonstrate with a real-world day to day example in digital marketing world.

    While Customer Service Chatbot is for sure one of the powerful aspects of saving time cost, I want to put the focus on another more important point which can be bought by the GraphRAG solution. Therefore I will keep the Customer Service level Chatbot description minimal.

    Besides, i will also skip all the description regarding some automation in programmatic (i.e. not AI) level. For example, Email auto forwarding with hard coded conditional logic based on the Email Title via Email API whenever an new Email received.

    Background

    A Individual Client , John, who owned a WordPress website created by us (DDM Group). He received the Spam Contact Us Form Email daily, which he made him feel annoyed. As we (DDM Group) is John’ website adminstrator, he complained to us.


    Trigger – Symptom

    Although John received the email because of the Spam bot of the Contact Us Form Submission in his website, he does not realize the fact and his complaint email is as below:

    Hi DDM,

    My email keep receiving rubblish Email daily. Please help to fix.

    In most of the time, the client or end-user , like John, can only use human daily language, instead of technical jargon , to describe the problem they faced.

    And most important is that, the event which trigger the action (e.g. write a complaint email) is normally come from a Symptom which drive his emotion (e.g. Fear , Annoying , Despair). Most of the time this Symptom is not the cause of the problem and instead is the consequence by itself.

    For easy communication, we named this “Trigger” as Symptom.

    Symptom = Rubblish Email

    Party Involved = Client


    Problem Pattern

    By asking John to submit the Rubblish Email to the Google Drive, the Technical Support analyzed that the Email is infact triggered by the Contact Us Form Submission in the existing Website.

    And therefore, the Technical Support classifed it as a “Spam Form Submission” Problem Pattern which was already reported by different client many times and therefore is named and indexed as “Spam Form Submission Problem Pattern in our system

    Problem Pattern = Spam Form Submission

    Party Involved = Technical Support


    Solution and Environment

    As stated before, the Spam Form Submission is a well-knowned Problem Pattern , as an experienced website administrator, DDM Group had already indexed and mapped different kinds of Solution for different scenario with the same Problem Pattern.

    Following factors affecting the choice of the Solutions:

    1. Client Contract Amount
      • VIP Client
      • Standard Client
    2. SMTP Sending Server
      • GMAIL API
      • SMTP Sending Server provided by Client itself
    3. Web Server
      • Proxy Server – Cloudflare

    In order to identify the Client Contract Amount , Web Server as well as the SMTP Sending Server specific to John’s case, the Technical Support and the Customer Service Officer have to access the CRM , as well as Website Development Production Database to lookup the Client Contract Amount , applied SMTP Sending Server and Web Server.

    After lookup, we figureed out that John is a VIP Client and using GMAIL API and Cloudflare.

    The Technical Support, based on his years of experienced and know-how in cyber security knowledge domain , realized that the main reason of the Submission Contact Us Form being spammed is due to the fact that some kinds of Spam Form Bot constantly crawled John’s website and realized the website is using some popular open-source plugin which triggered vulnerability exposure, leading the Spam Form Bot can easily fill in the form in John’s website automatically. In order to stop being spammed , the best way which the Technical Support can think of is to let the Spam Form Bot cannot even reach John’s website. And hence the Solution of Server Level WAF (Firewall) installation is chosen due to the fact that the Cloudflare Proxy Server supports WAF Firewall.

    Environment = VIP Client , GMAIL API, Cloudflare

    Party Involved = CRM Manager + Techncial Support

    Solution = Server Level Firewall (WAF)

    Party Involved = Technial Support


    Deliverable (SKU) and SKU Feature

    Once the Solution is confirmed, the case is passed to the Account Manager (i.e. Salesperson) to follow up and explain to the client.

    While the Technical Support does not quite familar with the SKU Name in the SKU Library, he suggested to the Account Manager to visit the SKU Library in DDM Group and search for search term “Cloudflare WAF”

    The SKU Library come out with the following SKU#

    SKU NameSKU#
    Cloudflare WAF – Standard5232323
    Cloudflare WAF – Premium5232345
    Wordfence (WordPress Firewall)8475623

    Due to the fact that the SKU name by itself cannot faciliate the decision on which SKU to be chosen to solve the problem, the Technical Team further dives into the SKU Feature of the 2 Cloudflare related SKU and realized that only Cloudflare WAF – Premium (#5232345) supports the Legitimate Bot whitelisting feature.

    SKU = Cloudflare WAF – Premium

    SKU Feature = Legitimate Bot Whitelisting

    Party Involved = Account Manager


    Target Audience Properties and Sales Trigger

    As an seasoned and proactive Account Manager, he realized that it is a good opportunity to upsell another SKU to John due to the fact that the Spam Submission Form alerted him for the cyber security concern.

    The Account Manager googled the knowledge and figured out that Login Attempt Attack (i.e. a Problem Pattern) is another common vulnerability which is suffered by lots of eshop like what John is running.

    The Account Manager , based on his experience, believed that Fear is a good sales trigger to have the intention purchase. In this sense, he told the potential risk of being login attempt attack by the malicious bot and suggested John to install another 2FA plugin which can effectively protect the unauthorized login.

    As the Account Manager that John have no idea on what a Login Attempt Attack is , he visualized the problem pattern by showing the visiting report which logged thousands of visits of the login page of John’s eshop with an hour.

    John felt worry about it and took the advice and purchased the SKU of 2FA Plugin Installation for WordPress, while the Account Manager successfully upsell a SKU related to John case.

    Target Audience Property = Eshop owner

    Sales Trigger = Fear

    SKU = 2FA Plugin Installation for WordPress

    Problem Pattern = Login Attempt Attack

    Sympton = Thousand of visits in Login Page in an hour

    Party Involved = Account Manager + Client


    Plugin for Production

    Once John signs the Sales Contract, the Sales Contract with the involved SKUs is passed to the Production Manager.

    While the Sales Contract enumerated the SKU name , it does not limit which plugin to use in order to deliver the SKU.

    Having checked with the Plugin Library regarding the error and bug reports for each plugin, the Production Manager decided to use the plugin WordFence for the 2FA related SKU and Cloudflare for the Server WAF related SKU.

    SKU = Cloudflare WAF – Premium

    Plugin = WordFence

    SKU = 2FA Plugin Installation for WordPress

    Plugin = Cloudflare


    Putting Everything Together

    When you put everything together, you may realize in fact you are doing the following steps:

    1. Enumerating and indexing all the factors (i.e. Column Name) observed from the real world , AND
    2. Enumerating and indexing all the option values for each factor
      • e.g. Fear / Hope / Greed in Sales Trigger Column
    3. Map the Option Value among each 2 columns under a Bipartite Data Pattern.
    4. Searching based on the need of different roles
      • e.g. As a Client or Account Manager role, search by inserting a value in any of the column (e.g. 1,000 login page visited in an hour in Symptom Column)
    5. Output the result in different columns based on different role.
      • As a Production Manager, refer to the SKU and suggested the related Plugin Name.

    In the real business world, there are thousands of factors (i.e. columns) that can be addressed, with each factors may have thousands of option value involved (e.g. a Sales Order Records), forming a infinity number of nodes and edges of a Graph, which can be only comprehensively memorized and handed by machine.


    Conclusion

    I hope you can understand the problem pattern involved in the real world and realise that the learning activity of a human being is in fact based on enumerating , indexing , mapping and searching. 

    By applying the GraphRAG Enterprise Knowledge Graph SaaS Web App (i.e. bGraph), it can automate and speed up the learning of a human being based on following open-source technical stack:

    1. Retrieve the Data via
      • Web Scrapper for Public Domain Knowledge
      • APIs for Public Domain Knowledge (e.g. Weather Condition)
      • APIs For Private Domain Knowledge (e.g. in-house CRM)
      • Domain Specific Know-how provided manually by in-house expert
      • Meta Data (e.g. Data Schema , Business Logic) in different data silo (e.g. CRM or POS) from Data Lake
    2. Text Embedding the retrieved Data into Vector Database
    3. Entity Extraction from the retrieved Data and store in Graph Database
    4. LangChain to orchestrate multi AI models (e.g. Image / Text / Voice)
    5. LLMs (e.g. ChatGPT) to comprehend the content stored in Vector or Graph Database
    6. Adaptive RAG Function to
      • Retrieve the Search Query from the Client
      • Refine their query to useful question
      • Retrieved the data from Step#1
      • Comprehend the Data
    7. Semantic Search Engine (Search Bar or Chat Bubble) to allow user to insert their Search Query in
      • Plain English
      • Not precise wording
    8. Visualize the Output via Graph Database and Graph Data Science Library to solve the following problems:
      • Shortest Click Path between 2 concepts
      • Centrality
      • Community Detection
    9. Output the result via a Chat Bubble by Streamlit.

  • bGraph Architecture – Model Data

    bGraph Architecture – Model Data

    Introduction

    The objective of this article is to provide a blueprint which demonstrates and enumerates all the technical stacks used to build the bGraph.

    Although using a Graph Database is a perfect tool to illustrate this kind of blueprint, ironically, we cannot use the Graph Database to demonstrate how to build a Graph Database because the Graph Database is not yet built.


    Definition

    bGraph

    bGraph is a DDM terminology , which is assigned as the name of the Enterprise Knowledge Graph (EKG) built on top of Graph Database. You can regard the bGraph as a Knowledge Management System in DDM Group which consolidates all types of data , including Business Data, Meta Data and Model Data, into one place forming a supreme intelligence to answer any questions raised by either Clients or Staffs.

    Architecture

    Architecture of bGraph refers to all the technical stacks used to build the bGraph, as well as specific tools that we adapted for building the bGraph. You can regard it as a blueprint of the bGraph


    Model Data

    While there are many components which can be found in the bGraph Architecture, this article is focused on the component of Model Data. The best way to understand Model Data is to compare the Model Data with Meta Data and Business Data.

    In the Database world, no matter what business it is running , Data can be classified as 3 categories : 

    Business Data

    The data which reflect the business activities. For example, in an eshop a Watch is sold out to the Client named “Tony” with the price of USD$42, the “Tony” and “USD$42” will be regarded as the Business Data.

    In an Excel File, you can regard the Column Name as the Model Data , while each record under the same column as Business Data. For example, If you have an Product Price List an Excel File as below:

    Product TypeProduct Price (USD)
    Watch42
    Shoe30
    Figure 1 – Product Price List

    The Column Names Product Type and Product Price (USD) are regarded as Model Data, while the records [Watch,42] and [Shoe, 30] are regarded as Business Data.

    Meta Data

    It also means “Data of Data” , which the function of Meta Data is to describe the Model Data. With the same example, as an eshop webmaster, before you can sell the product in the eshop, you should have input the price of the product Watch in the Price Field in the backend of the Eshop. Instead of a Text String (i.e. US Dollar Forty-Two) in Data Type, you will expect the Price is filled in Number Format (i.e.42). In this case, the Numer (instead of Text String) is the MetaData which describes the Data Type of the Price field.

    Model Data

    In a relational table (e.g. a Sheet in Excel File), you can regard the Column Name (or a Field Name in an Form) itself as the Model Data , while each record under the same column as Business Data. For example, in Figure 1 – Product Price List in previous paragraph, The Column Names Product Type and Product Price (USD) is regarded as Model Data, while the record (i.e. the value of the cell) of [Watch,42] and [Shoe,30] are the Business Data.


    It is imperative for us to differentiate the 3 categories of data due to the fact that different types of data are intertwined in our communication during the bGraph development cycle. 


    What Problem Patterns the Model Data Solves

    Model Data can narrow the discrepancy between the Reality and Model in following aspects:


    Avoid Duplicated description in the Data Model

    It is very common to find both the CRM and an Accounting System in any scale of the companies, which means if you want to insert a new record of the First Name and Last Name of a Client, most likely that you have to record it twice in both the CRM and Accounting System.

    While in reality the Client shows only once, in the Model it has shown twice in both CRM and Accounting System even though the 2 records in different systems are in fact referring to the same Client, meaning that the Model Data – First Name and Last Name of the Client, are duplicated. 

    This discrepancy between the Reality and Model lessens the fidelity of the Model. 

    Model Data is here to kill the discrepancy through duplication.


    As an Simple View of Truth Under the DevOps business environment

    In a traditional system development cycle, the Reality is being observed once in a particular time spot (most likely in a brain-storm sales meeting ) and this observation will be transformed to an Model, which most likely is presented by an Entity-Relationship Diagram, by the System Analyst.

    However, soon or later this System Analyst realized that it is not the case. While in reality the business environment is ever changing, the observation to the Reality, as well as to Modeling the observation, become streaming tasks instead of batch tasks, meaning the observation and modeling tasks should be done continuously in agility, instead of only did once in the very beginning of the system development meeting. We called this concept as DevOps.

    Let’s illustrate the example by the Table in below:

    Time PeriodSystem NameProperties (i.e. Field)
    Year 1CRM (built in house)Client.FirstName
    Client.LastName
    Client.Birthday (DDMMYYYY)
    Year 2Accounting System (3rd party Saas)Client.GivenName
    Client.FamilyName
    Year 3Eshop (built in house)Client.FirstName
    Client.FamilyName
    Client.Birthday (YYYYMMDD)
    Figure 2 – All System Development Timeline

    In the infancy status (i.e. Year 1) of a startup company which you are working for, it makes sense to prioritise building a CRM system instead of an Accounting System in order to generate leads and sales revenue before complying with legal bookkeeping and auditing requirements.  In a CRM system, your colleague Anna, as a system analyst, can easily observe from the reality that there should be the properties First Name and Last Name attached to a Client. The system analyst (Anna) therefore put the First Name and Last Name in our Model in below:

    First Name
    Last Name
    Client Form (and Table) in the CRM

    It works perfectly until in Year 2, after there were quite a lot of sales orders made in Year 1, it is inevitable for the business to have an Accounting System to cater both the bookkeeping and invoicing tasks. 

    Due to the fact that the System Analyst , Anna, who built the CRM system in Year 1 had already quit, instead of inventing its own wheel, your boss in Year 2 decided to subscribe to a SaaS of a canned Accounting System, which has comprehensive functions catering all the bookkeeping and invoicing needs of the company.

    Everything works fine until a fresh grad junior Sales Executive , Ann, who is instructed by you to find out a Client with ID# 302392 in CRM in the historical sales invoice report in the Accounting System. After Ann checked out the CRM through the ID# 302392 and the system showed the First Name and Last Name of the client as Joan Lee. Ann tried to put the First Name and Last Name Joan Lee to the Accounting System to generate the sales order report. 

    Unfortunately , after 60 minutes of effort, Ann failed to find out the fields First Name and Last Name to filter the sales order in the Accounting System , she requested help from her supervisor, which is you.

    After you listened to the question raised by Ann, you are astonished that she did not even realize First Name is a synonym of Given Name and Last Name is a synonym of Family Name. (Please refer to Figure 2 – All System Development Timeline in previous paragraph)

    Although you are frustrated , you still gently explain the truth to Ann, which took you another 15 minutes. 

    Therefore, all in all the company had spent 75 minutes on simply communication and education, which these communication and education costs will not be the last time to be incurred due to the fact that the new fresh grad employee which the company is going to hire in the future is very likely to encounter the same misconception. 

    Therefore, a centralized library which explain the relationships between any properties of any systems throughout the company is on demand.

    The story did not end. With great difficulties the company still survived in Year 3 and would like to expand the business by running an Eshop online for overseas markets. 

    Your company hired another System Analyst , Joanna, to build the eshop which she had completed the project at lightning speed. After 100 new client registrations in the Eshop, when you want to import these 100 client registrations from the Eshop to the existing CRM, you finally realized that the field Birthday of the CRM is in format (i.e. the Meta Data) of DDMMYYYY , while in the Eshop the format is in YYYYMMDD.

    Due to the fact that you realized all the Date related fields throughout the systems of your company are in YYYYMMDD, which is contradict with DDMMYYYY format usually used in your country, you have no choice but to request the newly hired System Analyst Joanna to spend another 1 months (i.e. 22 Working Days!) to turn all the Date related Fields in the Eshop from YYYYMMDD to DDMMYYYY in format.

    By studying the example above, we realized that a centralized library (i.e. the repository) which stored all the Model Data (and its associated Metadata) will definitely help the System Analyst to avoid all the mistakes mentioned above by checking all the existing  properties (i.e. the Model Data) of the existing systems in advance before the System Analyst started building any new system. 


    Fill in the gap between planning and execution

    Following steps and role are played during the system development cycle:

    TimeProcedureRole
    Month 1Reality ObservationSalesperson
    End User
    Business Analyst
    Business Owner
    Month 2ModelingBusiness Analyst
    System Analyst
    Month 3System Building ExecutionSystem Analyst
    Timeline and Role during the System Development Cycle

    Consider the following scenario and timeline

    Reality Observation

    1. In Month 1, End User feedback to the Salesperson that the CRM lacks of the Salutation field in the Client Form.
    2. Salesperson passes this information to the Business Owner.

    Modeling

    1. The Business Owner instructs the Business Analyst to see if the request is valid.
    2. In Month 2, The Business Analyst updated the System Blueprint (i.e. the Entity-Relationship Model) and passes the newly updated version to the System Analyst

    System Building Exeuction

    1. In Month 3, the System Analyst studied the affected radius in the entire system and if which Forms and Reports will be affected. For example, the New Client Form , as well as the Lead Report may be needed to add the Salutation Field into them.

    If you are detailed-mind enough, you may realize that , as a layman without any system analysis training background, the End User , Salesperson and Business Owner cannot technically and precisely turn their comment via Entity-Relationship Diagram friendly syntax to communicate with the Business Analyst. 

    Imagine what if all these 4 different parties involved in the communication chains are communicating by different language and wordings, how the fidelity of the reality has been deteriorated , and how much time is wasted on the redundant communication edge. (i.e. A to B , B to C , and C to D)

    This means if the comment feedback from End User is not at the same time as the System Analyst to do the coding workload for updating the system , then this piece of comment from End User (i.e. comment on adding a new Salutation Field) should be recorded in somewhere and easily be found by the System Analyst in their system update request job queue.

    The Model Data can act as a communication protocol during the whole system development cycle.


    Avoid Duplicated Workload between Template and Instance


    Model Data in Relational and Graph Database

    Model Data in Traditional Relational Database

    In a traditional way of building a CRM system, the Object Client may probably be described in the Entity-Relationship Diagrams in different systems as below:

    Column Name
    First Name
    Last Name
    Salutation
    Email Address
    Client Table in ER Diagram of CRM System

    When time goes by, another eDM System is introduced into the company with another Client Object inside the system as below:

    Column Name
    Given Name
    Family Name
    Salutation
    Gender
    Email
    Client Table in ER Diagram of eDM System

    Due to the fact that there are 2 separate systems, you cannot link up the 2 Client Tables of 2 systems in 1 Entity-Relationship Diagram. In fact, you have to draw 2 Entity-Relationship Diagrams, one system per Entity-Relationship Diagram.

    This practice makes us can never realizes that in fact these 2 Client Objects in 2 separated systems are actually referring to same concept (i.e. Client) in the reality

    Besides, if you find the field Gender is a valid and useful information in eDM, the system analyst may not address that this Gender field should also be added into the Client Table in the CRM system.

    Model Data in Graph Database

    On the contrary , if we demonstrate the Model Data via Graph created by Graph Database, we can enjoy the following benefit:

    1. Concept Client from CRM and eDM systems can be consolidated and presented in 1 Node. This consolidation can easily be figured out by the Node Labels (i.e. the wording eDM and CRM outside the Node circle)
    2. One can easily find out the relationship of properties from 2 separate systems. For example, the graph explicitly shows that the Given Name in eDM is in fact identical to the First Name in CRM by reading the Relationship Type (i.e. IDENTICAL_TO)
    3. While the property Gender is a useful information which should define (and have defined) in eDM, it makes sense to infer that this Gender property should also be defined in CRM. By using Graph Data Science AI tools, this kind of insight (we called it Label Prediction) can easily be achieved. While the AI algo is out of the scope of this article, we will discuss it somewhere in the future.
    4. In the future, as the business grows, you will realize clients can be classified as Individual Client and Organisation Client, which only Individual Client has the properties of First Name and Last Name (so on and so forth). You can easily modify the relationships among nodes by writing a simple GraphQL Statement.

    Limitation of Model Data via Graph Database

    Although modeling data with a Graph Database provides greater fidelity, the Graph Database in itself is not good for data input. 

    While in our daily life most of the Input Form and Report are linked to underlying Tables in a Relational Database, it is hard for us to build the Input Form and Report directly on top of a Graph Database. Although it is technically feasible to do so, due to the compatibility with other existing systems, as well as the human user behavior in both inputting and consuming data, the technical stacks will strike a balance between user experience and Model Fidelity.

    In this sense, we decide to keep the Relational Database as an “Abstract Layer” between the Frontend Application (during Input) by both human / machine (i.e. API) users and the Graph Database.

    The toughest trade-off of this method is that we need to periodically synchronise , either in mutual (2-way) or in 1-way , the data between the Relational Database and Graph Database, although it’s still manageable .


    Technical Stacks of the Model Data

    1. Node Table

    Create a Table name “bNode” in Relational Database to store (as records in a Table) all the Nodes.

    This Node Table can also serve as a LookUp Data List as if traditional Relational Database does. For example, as the Option List of Gender {Male | Female | Trangender | Unisex} will always be the same no matter under which system or knowledge domain, there is no need to define the Option List of the property Gender for each system (or each instance of a system type). This Option List of property Gender can be looked up by different systems via their Gender Field, this is nothing about Graph Database which already serves the purpose perfectly. 

    1. Relationship Table

    Create a Table name bRelationship in Relational Database to store (as records in a Table) all the relationships among the Node.

    Example Record in a Relationship Table:

    Source NodeRelationship TypeTarget Node
    ClientHAS_ONEFirst Name
    ClientHAS_MANYEmail Address
    First NameIDENTICAL_TOGiven Name
    1. Importing both Node and Relationship Tables in the Graph Database, whereas:
      • Use the feature of Graph Database – Node Label , to classify which Knowledge Domain (a.ka. Namespace or Context) the Node is under. In the CRM example, the Node First Name is under the Knowledge Domain (i.e. Namespace) of CRM, and therefore you can find the Label outside the Node First Name in Figure 3 – Data Model By Graph.
    2. While there are many ways to import the data from a Relational Table into the Graph Database, we will apply the following ways under different scenario:
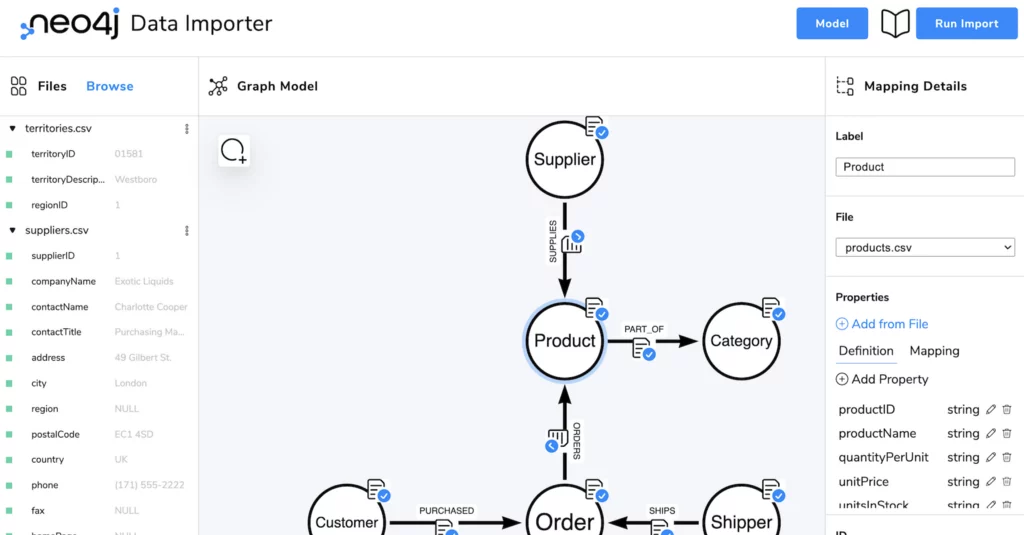
      • By Cyber – Lollipop Model
      • By Data Importer GUI – Sunflower Model
    3. Synchronize (either 1-way or 2-way) between Relational Database and Graph Database under CRUD events.
    4. Allow Read/Write with different views (a.k.a Prospective) by End Users via GUI in Graph Database by coding (e.g. Cypher)
    5. Allow the User to Read/Write with different view (a.k.a Prospective) by End Users via GUI in Graph Database semantically by plain English. (or other Language) via Semantic Search Engine.1

    Footnotes

    1. This will be performed by LLM Algo which is out of the scope of this article. ↩
  • bGraph for Business Process Management

    Introduction

    While in article Build a Business Process Management System – Stage of System Building we have defined that the 1st stage of building a system is Modeling, in article Build a Business Process Management System – BFs-WAITER Pivot Table we have further named the content or directions that we should included in the Modeling stage as BFs-WAITER.

    No matter how comprehensive the model can reflect the intricacies of the real world, we should have a tool to effectively transform the model to an executable system with a human interface, namely bGraph in Diamond Digital Marketing Group. Before we dive into the functionality of the bGraph, in order to sharpen the effectiveness of the it, it is always a good practice to enumerate the problem patterns that we encountered when using traditional tools.


    Problem Patterns in Modeling Stage of BPM Building

    Polymorphism in communication

    In the very beginning of a Modeling Stage, the Business Analyst (or Consultant, whatever you name it) will conduct an interview to the stakeholders of the target company in order to collect the information relating to the target business process. Any kind of documentation collection, verbal description, or even on front line field observation is carried out by the Business Analyst to be familiar with the target business process.

    After the Business Analyst finished the interview, he/she should spend time on organising the data into information and pass it to the System Analyst (and his/her programmer team) and bring the BPM System Building stage to Stage 2 (Standardization). 

    However, different target businesses, different Business Analysts or different clients, will always use different wording or language to describe the same concept. For example, while the client will refer to the product they are selling as Product, Business Analyst will name the Product as SKU. Another example is that the wording Last Name is a synonym of Surname, which can be used interchangeably.

    On the contrary, Business Analyst and Client will use the same wording to refer to different business concepts. One of a typical example is the term “Client“. In a manufacturing industrial chain, no matter if you are the Manufacturer, Distributor or the Retailer ,you will always name your downstream as “Client”. During a BPM System Interview, a  Business Analyst needs to pay double attention to figure out who (Manufacturer, Distributor or Retailer) the term “Client” is referred to. As a professional Business Analyst, we will name them as the Brand, the Merchant , the Retailer and the End User respectively in order to uniquely identify them.

    This polymorphism in communication not only occurs between the Client and Business Analyst, but also the Business Analyst and the Programmers. The more different wordings are used , the more resistance will be derived during the communication. 

    Therefore , a communication protocol which can synchronise the wording is necessary.


    Duplicated Analysis Wordload with Different Clients

    No matter which industry , country or business model the client is in, a CRM system will always share some common properties and features. 

    For example, the client will expect a standard CRM to have a Contact module which at least has First Name and Last Name as the properties of the object Contact.

    As a Business Analyst , in a BPM System Interview, you may not want to waste both you and your client’s time to go through what common properties a CRM System should have, which those common properties may properly went through many times in the previous similar project.

    On top of it, it is a must for a CRM to have a Country field for the users to fill in the nationality of the client. As a Business Analyst, you may not want to go through the comprehensive list of countries again and again in different projects.

    In this sense, it will be a great time saver if we can have a CRM System Building Template which comprises all the common properties of  a standard CRM.


    No Trigger On Searching Similar Functions in Previous Project.

    Even though you (as a Business Analyst) are driven by public-spiritedness that you already encapsulated a comprehensive Country list as an array for next project use, how can the other Business Analyst , or even the future yourself, remember or realize that you have already created the Country List before?

    Even worse, the concept Countrycan and will occur not only in CRM , but also almost any kinds of system like Project Management System, Eshop or Booking system. What will make (i.e. trigger) the programmer who is going to build a Booking system think that he can refer to the previously built CRM system to find out the Country List? If he/she cannot realize that a Country list already existed in some other project blueprint , he/she may probably will spend time to do it again, what duplicated the cost of development.

    If the next Business Analyst does not realize that you have already done this before, he will not search for the Country List. There is always a gap between searching for the solution and the solution itself.

    Unique Wordload with Different Client

    Although there are many properties in common in  a CRM system, there are different properties too. For example, while a trading company may expect a Contact is defined as a Company or Organisation which should have Company Name field, a Beauty salon may expect all their Contact is an individual which should have First Name and Last Name field. 

    It is necessary for us (Diamond Digital Marketing Group) to have a system which stores all the common and differences of building different systems for different clients.


    Streaming (vs Batch) BPM Building Process

    To continue the example of CRM system building, as a Business Analyst, even though you have carefully listened to your client and clearly defined the common and different fields of the target CRM system after the 1st interview, it is very unlikely that you can hit a home run to gather 100% of the expected features and properties of the target CRM system in the 1st interview. While a system building is a lengthy project which always lasts for months or even years, the business environment is probably changed from time to time during the target CRM system building period, which will also affect the features and properties of the target CRM system.

    Imagine a scenario as below:

    In Day 1 the Business Analyst suggested the field First Name and Last Name to be included in the Contact Module of the target CRM system. In the very next Day 2 , the programmers have already kicked off the program coding workload and created a Table in the Database , as well as the First Name and Last Name Field in the user interface. 

    However, in Day 3 due to a new Marketing Manager (a “she”) on board from the client side, she perceived that the fields Maiden Name and Middle Name are common sense and should also be added into the Contact Module. While she passed this request to our Business Analyst, and then our Business Analyst passed this request to the programmers on Day 5 by directly appending 2 New Columns Maiden Name and Middle Name in the CRM system Building Blueprint Spreadsheet. 

    This behavior will make the programmers confused because (if you have paid attention to our story) the programmers had  already completed the program coding workload in Day 2, how can they realize that 2 new columns are appended to the CRM system blueprint spreadsheet which they had just brought to coding?

    Even though you may suggest that the Business Analyst can notice the programmers after they had done any adjustment in the blueprint spreadsheet, due to the fact that the specification of the blueprint is in fact under a streaming status which can be and will be changed from time to time, it will be impossible for the programmers to build the system based on a ever changing blueprint. Do you expect the programmers to click if there is any modification in the blueprint spreadsheet every 1 hour?

    In this sense, a streaming oriented system blueprint is necessary for the communication  between the Business Analyst and the Programmers, instead of a traditional system building blueprint which only reflects an instantaneous time spot. 

    This streaming oriented communication mechanism not only satisfies the modification need during the development status, under a DevOps concept, but also in the future after the system is brought to production due to the fact that the system is a living organism which is dynamic to the ever changing business environment. The traditional Batch (or Versioning) oriented can not satisfy in this sense.


    Mobility of the System Building

    As an experienced Business Analyst , you can imagine that no matter how you ask your client to submit an expected new field or new feature of a system via a submission form, the client may probably not follow your instruction and simply send that expected new field to you via email or even WhatsApp.

    After you receive the request from the client, instead of only simply forwarding the request to the programmer to handle, as a responsible and professional Business Analyst , it is our duty to validate whether or not the new request is a valid request (most of the time the request is invalid).

    For example, if the Client complains in the Contact module of a CRM that the field Sex is missing in the Form in the user interface,  you should first of all go to the project blueprint to check whether the field Sex should be included in the blueprint. If the Sex field can be found in the blueprint but not in the Form in the user interface, then you should contact the programmer to fix it up. But in the real world, most of the time after you conduct the checking, you will realize that the field Sex is in fact named as Gender in the Form in the user interface of the Contact module. 

    Can you imagine this kind of back and forth checking and non productive communication is the main cause of eroding the time on production.

    Think about if you are handling 10 BPM system building projects on hand , how can you quickly open a system (if there is any!) in your mobile device to check whether the complaint from one client is valid or not? If the complaint is valid , how can you quickly send an instruction to the programmer to fix the bug, provided that you are not seated in front of the desktop but instead on the way travelling to the next client meeting?

    If you find the complaint is valid and is a critical path of the project which if you don’t fix up the bug immediately the error will cascade to the next node of the critical path of the project which in turn derives an irreversible catastro, you cannot afford to notify the programmer after you finished the meeting. 

    A powerful steaming BPM building system is necessary for catering all the mobility needs of the communication.


  • How to Comment in Teamwork.com

    How to Comment in Teamwork.com

    Definition

    Comment in Teamwork.com can be used to response any Task , SubTask or Milestone by either assignee (i.e. collaborator) or the assignor (i.e. Project Manager) of the Task.


    How Comment in Teamwork.com looks like


    What Problem Patterns the Comment solved

    Accessability

    Not only can you use the Teamwork.com interface to place the comment, but also you can place the comment via replying by their mobile phone the comment email sent to the collaborator registered email address, which is good for the collaborator who is not always stuck to the computer.

    Task Instruction Optimisation

    All the Task Comments will be reviewed by the assignor. In case the assignee had left a feedback in the Task Comment that for some reasons he/she could not execute the task, for example, due to the lack of Login Password Credential provided in the Task Input, the assignor will update the Task Instruction Framework Template such that the same type of Task can be carried out smoothly next time. 

    In this sense, the Task Comment is acting as a media of nurturing the positive loop of optimising the quality of Task Instruction.

    As a Knowledge Repository in DDM’s Group

    Knowledge Repository means a knowledge library which stores both the theory and execution experience of carrying out a task. No matter the experience is successful or failure , they are both valuable as a failure experience can eliminate a trial and error testing of a specific task. 

    While all these theories and experiences are stored in the comment, the Knowledge Repository in DDM Group will crawl the Task comments so that the teammates can refer to this Knowledge Repository when they face the same type of task.


    Guideline on how to Comment in Teamwork.com

    While you can write whatever content you want in the comment, there are some little tricks for you to communicate well.

    Mention a specific Collaborator

    Please always mention a specific collaborator that you want him to read the comment, otherwise all the collaborators inside the loop can and will read the comment and they will be disappointed because the comment is irrelevant to some of the collaborators.

    You can mention a particular collaborator by simplying typing in the comment box like the example in below:

    @Tom

    If you want to mention the whole Company, you can type in the comment box like the example in below:

    @DDM1


    Replying previous Comment

    Unfortunately there is no nested comment in teamwork.com. (i.e. you cannot comment the comment). As an alternative, you can create a new comment and refer the previous comment that you want to reply

    1. Visit the comment that you want to reply
    2. Copy Link

    You will copy the link like below:

    https://diamonddm.teamwork.com/#tasks/21835467?c=20415136

    21835467 is the Task# , while 20415136 is the Comment# (i.e. c=)

    1. Copy the Comment URL into a new comment
    2. Press Icon Black Quote in the Comment URL

    Or alternatively you can simply copy and paste the referring text and add a Icon Black Quote as a blockquote so that the reader will understand that the Comment under the quote below will be the reply of the quoted Comment.

    Please be reminded that you should NOT blockquote the new comment you just added. You should only blockquote the text in previous commnet. Otherwise , the reader will have no idea on which paragraph is quoted from the previous comment, and which pargraph is newly written by you.


    Answering Output Request

    If the purpose of leaving the comment is for answering the request from the Output session in the Task Instruction, following rules should be complied:

    1. The number of answers should always match the number of output requests in the [Output] Session. I.e. If there is 2 Output Requests in the [Output] Session in the Task Instruction, you should always reply 2 answers in the comment.
    1. ALWAYS write the Output# (referring to the Output# in the [Output] Session in Task Instruction) PAIRING with the associated answer in the comment.2

    Output#2

    The answer of output#2 is that ……


    Comment which can only be read by DDM Group internally

    Occasionally you may want to place comment only to your teammate and don’t want your client to read that comment. You can easily do this by

    1. Privacy > Set Privacy
    2. Tick (or untick) anyone you want (or not want)

    Leave Comment via Email Reply

    Sometimes when you cannot access the Teamwork.com interface or you are outside and only have a mobile phone on hand, you can leave the Comment to the task by simply replying the Email sent from Teamwork.com regarding a specific Task.

    After you have replied the comment by sending an reply email via your Email Interface, your reply can automatically be shown in the Comment of the associated Task inside the Teamwork.com interface.


    Reply the Comment with Cap Screen or Image

    Besides attaching image files via File Attachment, you can simply directly copy and paste the cap screen or image into the Comment Box via the Teamwork.com Interface.

    DO NOT forget to wait until you can see the uploading bar shows 100% before you press Save Comment.


    Conclusion

    After you have placed the comment , as a good citizen please always type (and only type) the #Task + Comment # (e.g. #28929393c20392733) in the associated Project Whatsapp Group and mention (e.g. @Tom) the recipient that you have already placed a Comment in Teamwork to remind him/her to read the Comment.

    Good Practice of the conversation in Whatsapp message on reminding the reipcient will be as below:

    @Tom

    #28929393c20392733

    2024 Sales Report

    Please always be reminded that Whatsapp Group is acting as a reminder only. Therefore, only 3 components are supposed to be shown in the reminder Whatsapp Message:

    1. Group Participant that you want to mention
    2. #Task + Comment#
    3. Identifiable Task Topic

    Always encourge the participants to check the details via Teamwork.com Interface.


    1. Provided that DDM is the target company that you want to mention as a whole. ↩
    2. Imagine if there is 10 Output requests in the Output session and you didn’t enumerate which Output# you answered in the comment, how can the Assignor know which Output# you have done and which you have not? ↩
  • Marketing Nerual Networking Model

    Definition

    A Neural Network Model, also known as an artificial neural network (ANN), is a type of machine learning model inspired by the structure and function of the human brain. 

    While this model is applied in the Marketing domain, it becomes the Marketing Neural Networking Model.

    Instead of diving into the intricacy of the mathematical formula and operation, we instead will put the spotlight on the semantic logic behind the calculation.


    What Problem Pattern the Marketing Nerual Networking Model Solves

    Formulate Markeitng Strategy via A.I.

    In a nutshell, while Marketing Consultant is mainly to providing Marketing Strategy, a Marketing Strategy is simply making a series of decisions on how to choose among alternatives. For example, if you want to sell a Tattoo Printer to teenages, will you use Facebook or Instagram to promote your product?

    To choose between “Facebook” or “Instagram” (i.e. 2 alternatives) is called Marketing Strategy. For sure, in reality, it always takes more than 1 factor (or attribute) to make a decision, and takes more than 1 decisions to formuate a strategy . You can imagine it’s in fact a dynamic decision chain in which the outcome of 1 decision will affect not only the outcome, but also even the option values (i.e. all alternatives) of the decision.

    The Marketing Neural Networking Model is purposed to learn and solve how to make decisions in a scientific way.

    Only after we turn the decision making process in a scientific way can we automate the decision making process via A.I. by applying the Marketing Neural Networking Model, which in turn creates an A.I. Marketing Consultant.


    How Marketing Neural Networking Model look likes

    Although the intricacy of the Neural Networking Model is a bit scary, decoupling it in piecemeal and demonstrating with a story, will definitely aid you to comprehend the concept more efficiently. Bear in mind that it is obviously a simplified example which in reality will be 1000 times in scale.

    Before starting the story, allow us to provide you the legend of the Figure (Marketing Neural Networking Model) above:


    Rectangle ( ▭ ) : The Attribute (or Property, or Layer) of the Object, which the Object is the Marketing Neural Network Model.

    Circle (○) : Nodes (i.e. any Business Concepts)

    Sold Line ( ⎯⎯ ) : Positive Edges which has directionaly relationship between 2 Nodes

    Dot Line (···) : Negative Edges which has NO directional relationship between 2 Nodes


    Imagine you are the CEO of a conglomerate which at the same time run a Fashion Retail Store as well as a Diamond Wholesaler business. You are required by your shareholders to incrementally increase the ROI of the conglomerate by 10X, which is quite an impossible mission. In order to achieve this goal, you start by enumerating all the “Concepts” (i.e. the Node) in your mind which related to the business as below:

    1. Fashion Retail Store
    2. Diamond Wholesaler
    3. Website
    4. Google Merchant Center
    5. Linkedin Business Page
    6. Ads
    7. Payment Gateway
    8. Feed
    9. Enquiry Form

    In reality, the process of addressing , enumerating and filtering all the Concepts (i.e. the Nodes) relating to the business is almost an impossible task for human beings. The more knowledge Nodes the marketer acquired and manipulated, the more professional he is.

    Back to our story, immedate after you enumerated all the Nodes in your mind which you think are related to your business, you addressed some pattern that there are some patterns within these Nodes:

    Causal Relationship

    Having played around with the interface of the Google Merchant Center for a day, you realized that Google Merchant Center is mainly designed for listing the products in the storefront of Google Shopping Tab in retail price, and therefore the Google Merchant Center is better to apply in any retail instead of wholesale business because there is no any field for the Google Merchant Center to insert any tiered pricing or bulk discount in the storefront. In this sense, you addressed that what Digital Assets (Attribute) you are uisng will be dependent to the Business Model (Attribute 1). Therefore you deduce your own business rule (which is called business intelligent in the business world) as below:

    Business Rules 1 : Digital Assets is dependent to the Business Model

    By applying Business Rules 1 in your business, you decide to adapt the Google Merchant Center into your Fashion Retail Store (Edge 2) and meanwhile NOT adapt in your Diamond Wholesaler business (Edge 5)

    Correlation Coefficient

    While having 10 years experience on using Linkedin Business Page, you understand that the users who are responsive in Linkedin are mainly seeking for business opportunities (i.e. B2B) instead of retail purchasing (i.e. B2C). Although you have this “insight”, you still from time to time scrolled to some Feeds in Linkedin which are selling to retail customers. As you cannot 100% sure about your insight, and therefore you classify it as a Correlation Coefficient (denotes “r”) relationship which the Correlation Coefficient of the responsiveness between Linkedin Business Page and Retail Business is low (e.g. r=0.3) , and meanwhile it is high (e.g. r=0.9) between Linked Business Page and Wholesale business.

    In this stage, you can bypass the understanding of the mathematical operation of the Correlation Coefficient. What you need to know is simply that the higher the value of the Correlation Coefficient (r) , the closer the relationship to (Positive) Causal Relationship.

    Now based on the Correlation Coefficient which is conducted by your empirical study, you deduce other Business Rule as below:

    Business Rule 2 : The responsiveness of the Linkedin Business Page is high for Wholesale Business and low for Retail Business.

    By applying Business Rules 2 in your business, you decide to adapt the Linkedin Business Page into your Diamond Wholesaler Store (Edge 6) and meanwhile NOT adapt in your Fashion Retail Store business (Edge 3)


    By continuing deducing the Business Rules based on your experience or any other statistic, you figured out the following Business Rules for the Edge as below:

    Decision#Involved EdgeBusiness Rules
    Edge #1 and #7Fashion Retail Store > Website > AdsFashion Retail Store needs Website as the landing page of placing Ads.
    Edge #1 and #8Fashion Retail Store > Website > Payment GatewayFashion Retail Store needs Payment Gateway to install in Website to receive payment from Client
    Edge #1 and #9Fashion Retail Store > Website > FeedFashion Retail Store needs put the Feed in the Website for content marketing articles publishing
    Edge #1 and #10Fashion Retail Store > Website > Enquiry FormFashion Retail Store needs put the Enquiry Form in the Website for replying questions from client.
    Edge #2 and #11Fashion Retail Store > Google Merchant Center > AdsFashion Retail Store needs Google Merchant Center showcasing their product in Google Ads Campaign
    Edge #2 and #12Fashion Retail Store > Google Merchant Center > Payment GatewayGoogle Merchant Center does not support Payment Gateway
    Edge #2 and #13Fashion Retail Store > Google Merchant Center > FeedFashion Retail Store needs to turn the Product Page of the website to Google Merchant Center’s Feed
    Edge #2 and #14Fashion Retail Store > Google Merchant Center > Enquiry FormFashion Retail Store does not support Enquiry Form Function
    Edge #3 and #15Fashion Retail Store > Linkedin Business Page > AdsAds placed in Linkedin Business Page is not appropriate for Fashion Retail Store
    Edge #3 and #16Fashion Retail Store > Linkedin Business Page > Payment GatewayLinkedin Business Page does not support Payment Gateway
    Edge #3 and #17Fashion Retail Store > Linkedin Business Page > FeedAudience of Linkedin Business Page is not expected Retail Feed from Fashion Retail Store showing in their Linkedin Personal account.
    Edge #3 and #18Fashion Retail Store > Linkedin Business Page > Enquiry FormThere is no Enquiry Form function in Linkedin Business Page
    Edge #4 and #7Diamond Wholesaler > Website > AdsDiamond Wholesaler needs Website as the landing page of placing Ads.
    Edge #4 and #8Diamond Wholesaler > Website > Payment GatewayDiamond Wholesaler does not expect the client to place order in the Website directly. Therefore Payment Gateway is not needed.
    Edge #4 and #9Diamond Wholesaler > Website > FeedDiamond Wholesaler needs put the Feed in the Website for content marketing articles publishing
    Edge #4 and #10Diamond Wholesaler > Website > Enquiry FormDiamond Wholesaler definitely needs Enquiry Form in the Website as the client will ask for product info and transactional info before placing order.
    Edge #5 and #11Diamond Wholesaler > Google Merchant Center > AdsDiamond Wholesaler may not need to place the Ads via Google Merchant Center Campaign because Google Merchant Center do not support tiered-pricing or quantity pricing function.
    Edge #5 and #12Diamond Wholesaler > Google Merchant Center > Payment GatewayGoogle Merchant Center does not support Payment Gateway
    Edge #5 and #13Diamond Wholesaler > Google Merchant Center > FeedDiamond Wholesaler may not need to sync the Product Feed from their website to Google Merchant Center because Google Merchant Center do not support tiered-pricing or quantity pricing function.
    Edge #5 and #14Diamond Wholesaler > Google Merchant Center > Enquiry FormThere is no Enquiry Form function in Google Merchant Center.
    Edge #6 and #15Diamond Wholesaler > Linkedin Business Page > AdsDiamond Wholesaler is appropriate to place Ads in Linkedin Business Page to seek for the management level Decision Maker or Merchandiser based on the Job Title Ads segmentation. 
    Edge #6 and #16Diamond Wholesaler > Linkedin Business Page > Payment GatewayLinkedin Business Page does not support Payment Gateway
    Edge #6 and #17Diamond Wholesaler > Linkedin Business Page > FeedDiamond Wholesaler is appropriate to publish Feed in Linkedin Business Page to seek for the management level Decision Maker or Merchandiser.
    Edge #6 and #18Diamond Wholesaler > Linkedin Business Page > Enquiry FormThere is no Enquiry Form function in Linkedin Business Page
    All Decision Combinations Table of the Marketing Nerual Networking Model

    Points to note

    1. Although there are only 18 Edges inside the Model, there are in fact 24 Decision Combinations that we need to make because all of the times we need to put all 3 Attributes (i.e. Business Model / Digital Assets / Digital Assets Features) together into consideration, instead of only considering 2 Attributes each time.
    2. (Business Model) 2 x (Digital Assets) 3 x (Digital Assets Feature) 4 = 24 Decisions. We call the product ⓘ of the multiplication Carterisan Productⓘ.

    What Problem Patterns the Marketing Neural Networking Model Solves

    Enumerating all Possible Decisions Combinations

    The reason why we need to enumerate all the possbile decision combinations is that while Strategy means “decision“, to formulate a Marketing Strategy, covering all possible decisions comprehensively is as important as figuring out the appropriate answer of a single decision.

    The only way to enumerate 100% of the decision combinations is by enumerating all the Attributes and all Option Values of each Attributes, and multiplying them all together to become an Cartersian Product. In turn, there will be no decision combination missing out within the Model (i.e. figured out exactly ALL possibilties within the Model, no more and no less) , provided that there are no relevant attributes in the Marketing Neural Networking Model that are missing out, which we will discuss this “bug” in upcoming chapter.

    Automating the Decison Making procedures by computer or A.I.

    Remember in the old days (or even today without A.I) you learn digital marketing strategies by listening from the advice provided by the senior digital marketing consultant to the client. Every time when you were participating in a client meeting, you were impressed by how deep the knowledge ocean that the senior digital marketing consultant acquired that seemed he could non stop sharing his knowledge forever. You dropped down every single piece of know-how into a notebook and dreamed of that you might become him some day when you acquired ALL his knowledge, although you never know how “exact quantity” of “ALL” knowledge is.

    Even if luckily , you did the miracle and learned “all” the knowledge and become another iconic senior digital marketing consultant, your next generation will encounter the same problem as you did, which he/she needs to take notes and learn piece by piece starting from a blank paper.

    This inefficient resistant makes the knowledge transmission process extremely slow, just like what human beings did in the passed 7,000 years since mankind’s history. 

    Bear in mind that the example that we made previously in this session only describes 24 decision combinations , which accounts for a extremely tiny portion of reality which probably has 10 of millions of decision combinations, which is far beyond the processing power of a mortal within his lifespan.

    In order to have a systematic way to record all the Knowledge Nodes and the relationships amongst the Nodes, the Neural Networking Model is a perfect candidate to provide a paradigm which turn reality into a conceptualised mathematical model to do the job , not only by human beings but also by computer, which it’s compute power can dramatically speed up the pace of learning by decade of years, and letting processing ALL decision combinations to be an mission possible.

  • About bGraph

    Definition

    bGraph is a term named by DDM (Diamond Digital Marketing) with the portmanteau of the prefix “b” and the word “Graph” . We apply the word “b” as the prefix due to the fact that the underlying system is built on top of Budibase (initial as “b”), which is a low code SaaS platform for building SaaS, which is a descendent of the AppSheet (i.e. another low-code SaaS Building platform) which we used before.

    Meanwhile , the component “Graph” is referring to the data pattern of how humans read, learn , comprehend , interpret and behave. Infact, as long as we want to find (or connect) every single concept that we know, we can apply a Graph pattern, which is backed by the Graph Theory invented (or discovered) by Leonhard Euler in the 18th century.

    What is bGraph

    bGraph (built by DDM) is in fact a SaaS (Software as a Solution) which is acting as a Knowledge Management System in DDM, which is a perfect tool to turn Graph Theory into a system which facilitates the users to learn , comprehend and behave.


    What problem the bGraph is solving in DDM

    Diamond Digital Marketing is a multi international corporation which drives our business engine to be exposed under different parameters:

    1. Multi Geo
    2. Multi Language
    3. Client from Multi Countries
    4. Client from Multi Industries
    5. Client from Multi Company Scale
    6. Multi Product
    7. Multi Job Title
    8. Multi Job Capabilities
    9. Fast Pace Technology innovation
    10. Multi Staff
    11. Multi Job Seniority (e.g. Rookie and Expert)

    Living within this ever changing business engine, anyone can imagine this is a disaster for us to barely maintain a business, not to mention to scale up.

    During the business process, there are 5 costs incurred in every single step or every single action of each team player within the whole organisation:

    Production Cost

    This is literally easy to understand. Product cost simply means the quantifiable and observable cost incurred during the production process.

    For example, when we want to write a human-written Article for SEO purposes, the Production Cost is simply the production lead time which (associated with an hourly rate) is spent by the copywriter to do the research on the knowledge domain, as well as the time on actually writing the article. As long as we provide a job description to limit the number of words of output of that Article , The Production Cost is quantifiable , observable with no doubt.

    Cost of Searching

    However, not every cost can be observed or identified easily like Production Cost. Under the same metaphor, before the copywriter can actually do the writing, he/she may need to understand the knowledge domain in advance. In fact, the time spent on research-oriented tasks can vary from hours to days, depending on what granularity you want to deep down. While the revenue that we can earn from providing the service to clients is with a cap (i.e. ceiling , or maximum) , the Cost of Searching can be infinity that you can “research” for years before writing.

    In a statistical way of thinking, while every time the revenue of the task “article writing” is limit with a maximum cap , the cost of the “article writing” is unlimited, which means after 1,000 times , eventually we will definitely have a lost (i.e. Cost > Revenue) with no doubt. (because revenue is limited and cost is unlimited)

    How to quantify the “search” actions, refine the boundary of research, and name the granularity (i.e. the deep down level) of the research is definitely a changeling task, which is more an art than a science.

    Cost of Error

    I think all of you who worked for a while have experience that your superior or clients will modify or even totally reject the service / product that you deliver to them. While our product / services in most of the time is charged based on the measurable quantity of the deliverable (e.g. Number of Words written / Number of hours in Research), the Cost of “Error” part which is rejected or modified by the clients can never be absorbed by the price that we charged the client.

    Imagine the case that when we promise to deliver an article with 1,000 english words to the client for USD$200, in fact we may write 5,000 words because we have modified 10 times due to the unsatisfactory feedback from the client. The 4,000 extra words (5,000 – 1,000) is the hidden Cost of Error that is hard to spot in a systematic way.

    Again, whenever our business engine has any hidden cost that cannot be absorbed by the price we charged the client, we will definitely have a loss after 1,000 times we sold out that product / service.

    Cost of Communication

    Every time we receive an order from a client, we should have a job description input from the client to guide what we should deliver. For example

    1. Number of Words
    2. Language 
    3. Tone of manner
    4. Delivery Time
    5. Presentation Format
    6. Scope of Knowledge Domain

    Imagine how much time we need to spend on communicating with the client the job description , not to mention that we cannot guarantee our Salesperson (i.e. the Training Cost) to remember all the job descriptions (among 100+ of different Tasks) and ask the client in the right time, and assumed that the clients can understand the questions and provide a correct answer, which is unlikely the case.

    Remember how often the job description has too much jargon that the clients do not understand and hence provide you a wrong job description input which the Salesperson passed to the production process, and in turn produce a wrong deliverable rejected by a client and finally we were requested to redo.

    The Cost of Communication incurred, again is hardly observable and hence not measurable and not be absorbed by the price charged to the client.

    Opportunity Cost

    Opportunity Cost in an academic way means highest option value forgone. In a common sense way it means how much you sacrifice when you make a decision.

    For example, assumed that your availability is only have 2 hours , if you spent 2 hours to accept an job copywriting job with an hourly rate of USD$20, you cannot spend the same “2 hours” to win a job with an hourly rate of USD$50, which means your Opportunity Cost of accepting the USD$20 offer will be USD$50 – 20 = USD$30.

    Put it in short, if you use all your hands to grab a penny, you have no hand to grab a dollar.

    Opportunity Cost is another typical cost that is hidden and hardly observed by the business owner.  Although technically you do not suffer any additional loss , you at the same time also cannot earn more which you should have.

    We can imagine that while there is only one way to make money (i.e. Selling Revenue) which is predefined and limited , there are 5 ways that we can lost money (i.e. Cost) which is hidden and unlimited.

    You can now understand why most of the businessmen failed. And imagine how many hours you have to spend on training the teammate to avoid all these costs, assuming that the business owner already recognized all these costs, which is unlikely to be the case.

    The objective of bGraph is to eliminate all these 5 types of cost as much as possible.


    How bGraph Behaves

    Before embodying the bGraph, allow me to introduce the bGraph Model which theories all the thinking and behaviour within DDM from the knowledge being acquired by us, to the services being sold out by us to the clients.

    While in DDM there are 1,000+ SKUd (i.e. the types of services) that we can provide to our client, each SKUd will go through the same procedures before it is successfully delivered to the client. We called these procedure “Knowledge Monetization”

    1. Problem Pattern

    To provide a metaphor is the best way to illustrate the concept. Imagine when your client wants to run a business online, he may need to “Build a Website”. Infact he will not know anything about building a website, he has no idea on what is wordpress, woocommerce, not to mention what is domain name or web hosting. In this case, the Problem Pattern that can be recognized by the client himself is “Website Building”.

    Therefore , probably he will search in Google “website building agency” or “how to build a website” as this is his perception entry.

    On the contrary, he will NOT search in google “domain name registration” or “web hosting service” as he doesn’t even know what this is about. He can never search for something out of his perception.

    We regard the “Problem Pattern” as the Trigger of the Knowledge Monetization process because this is how the story starts.

    Perception Status

    Problem patterns can be further classified to 6 status based on the Perception Status of the client regarding that particular Problem Pattern. The Perception Status highly affects the Sales Parameters when we (DDM) are communicating with the client.

    01 – Spotlight – In this perception status , the client heard of the service or products type name , but in fact does not know exactly what he is going to buy, or what he needs. SEO Service is one of the examples of [01 – Spotlight] Service. Other than the pronunciation “SEO” , the client most of the time does not know what the service scope is covered, how much it is , how to justify the price , what is the fine-grained specification of the service, or even what will be the deliverable or the KPI. Infact , the client just heard of the service / product name somewhere and he realised that everywhere in the world is talking about this. For the sake of FOMO (Fear of Missing Out), he is going to seek out SEO.

    Client Behaviour AspectBehaviour Description
    Price SensitivityExtremely Price Oriented. The only parameter that he is going to do the comparison among vendors  is price.
    Problem SolvingMost likely he cannot solve his problem by simply buying the service because he didn’t clearly define the problem , as well as the specification of the service.
    Order SizeSmall amount of the product or trial period of the service is what he is seeking for. He will not spend a lot to buy something that he don’t understand 
    Searching KeywordHe is going to (and can only) search for the most generic and iconic Keyword. (For example , “SEO”). He will not search for any technical terms (e.g. DNS Caching) 
    Do not expect him to search for any jargon (e.g. backlink) or service specification. 
    The search term still will not deep down to operational and executable level.

    02 – Learning by Reading – Some of the clients may step further to read through the internet / KOL after he went through [01 – Spotlight]. Under the metaphor of SEO service, the client, although most likely still not know how DNS caching may enhance the SEO performance, he may know that Keyword installation or Backlink Building is a common service scope of SEO. 

    03 – Learning by Doing – Having experienced the service from any vendor, the client starts to understand the logic behind the service. He may have encountered the Problem Pattern that he had never imagined before, and can comprehend what the vendor is talking about. To continue the example of the SEO service, the client may now realise that  it is hard to do the Keyword Research to enumerate all the Keywords relevant to his business because he lacks access rights to an Active Google Ads account. Or he may realise that it is very time consuming to build backlink by himself due to the fact that he needs to create a dummy account for each business directory or guest blog one by one by himself. 

    Client Behaviour AspectBehaviour Description
    Price SensitivityMore prone to Quality Oriented instead of Price Oriented 
    Problem SolvingMore willing to listen to the service scope that out of his cognition , which normally is the missing puzzle for solving the problem
    Order SizeMore willing to engage into longer service periods. 
    Searching KeywordSearch for the Problem Pattern during the operational procedure. (e.g. how to check if the black link is  “nofollow”)

    04 – Learn From Mistake – Having used the service for a while, the risk or error derived from the service that he did not purchase in [03 – Learning By Doing] (due to the fact that this service is out of his perception) starts floating up. Even worse, most of the time he cannot correlate the mistake he made , or the problem shown up, with what he service that he didn’t purchase before. Under the same metaphor of SEO service, the client may realise that the ranking of his website is not climbing up but instead dropping, although he did realise that the dropping of the website is due to a particular cause – backlink. What he only knows at this moment is that he is suffering from the mistake and needs to fix up as soon as possible.

    Client Behaviour AspectBehaviour Description
    Price SensitivityQuality Oriented and Responsive Oriented instead of Price Oriented.
    Less doing comparison among vendors. 
    Problem SolvingDedicated to solve the problem by all means in order to resume his business to normal condition
    Order SizeDoes matter as long as the problem can be solved 
    Searching KeywordSearch for the Problem Pattern and the Solution of the Problem Pattern.

    05 – Cannot Form Question to Ask for Help – This Perception Status is in fact the extension of 04 – [Learn From Mistake], which the main difference between Stage [04] and [05] is that the client even don’t know what is the reason that cause the problem he suffered in this moment. For example, the client who bought the SEO service from a SEO Agency found that in one day the ranking of his website dropped dramatically. He cannot even tell what step he or his SEO agency made to bring this result. The only phenomenon (Problem Pattern) that he can observe is that the ranking of his website dropped.

    06 – You Don’t Know What You Don’t Know –  In this Perception Status, the client doesn’t even address the problem. He may regard the Problem as Phenomenon (instead of Problem) because he does not think that he is suffering. Under the metaphor of SEO service, for example , while the homepage of his website is still shown up in the Google Search Engine Result, he may not realise that 90 out of 100 URLs in his website are not indexed by Google Search Engine because he never knew how many URLs his website actually had. 

    Client Behaviour AspectBehaviour Description
    Price SensitivityNot Price Sensitive No Quality SensitiveIn fact he is sensitive to nothing because there is no demand
    Problem SolvingAs the client does not address the problem, he is not going to fix up anything
    Order SizeNo Order as he as no intention to buy anything
    Searching KeywordWill not search for anything.

    2. Theoretical Model

    While “Website Building” is the only Knowledge node understood by the client, to run the business and provide the service to the client, of course we (DDM) need to master all the academic theory, knowledge and skill set behind .

    For example , to know how to build a Website, we should master:

    1. HTML
    2. MVC (Model-View-Control)
    3. OSI (Computer Network Communication Model)
    4. Colouring System
    5. 


    While you cannot directly ask for your client to pay for you after you tell him what is a <H1> in HTML tag , which instead your client will only tell you that he want to BOLD the Title of an article, (which in fact is executed via giving a <H1> tag to the Title) it is a prerequisite for you to know what is a <H1> HTML tag before you can build a website.

    Therefore, in there HTML is a Theoretical Model (i.e. the knowledge) that we should address in our bGraph.

    Features

    Theoretical Model can be further fine-grained to Features. For example, when your client is under the harassment of spam registration, he may only come to you with a Problem Pattern that he wants to block the spam registration (which is the Problem Pattern in this case) . Most of the time , he may not tell you that he wants to install a Firewall to block these spam registration, which in this case Firewall is the Feature (i.e. the Solution) that he wants to tackle the Problem Pattern.


    3. SKUd

    SKUd is a portmanteau used within DDM which consists of the acronym “SKU” which stands for Stock Keeping Unit, and the suffix “d” which stands for DDM (initial as “d”). The SKUd is named in order to differentiate it from the SKU of Client which we denoted SKUc.

    In reality , especially in a product based (in contrast to service based) business, the concept of SKU is easy to understand. While you visit a supermarket and buy a canned Coca Cola 350ml , this product “Set” is called a SKU with a SKU number because all those specific 100 cans of Coca Cola 350ml all have the same price, which therefore are classified under one SKU Number. 

    While you are purchasing a can of Coca Cola 350ml with the price of USD$1 and checkout, the cashier will pack you exactly that ONE particular can of Coca Cola 350ml, no more and no less. Definite, crystal clear.

    On the contrary, when you visit a hair-styling store and you request the stylist to deliver you a “beautiful” haircut , the term “beautiful” is in fact hard to define , measurable and quantifiable . 

    Not only because the term “beautiful” is subjective , the service time of the haircut cannot be always quantifiable. You never see that the charge of a hair-style is based on the number of hair or the length of the hair that the client possesses. 

    The ambiguous definition of the deliverable “beautiful haircut” can definitely derive lots of communication cost including the argument on the “beauty” of the deliverable, the service time , the attitude of how the hair-stylist service you , so on and so forth.

    Imagine if you are going to build a website for the client, following specification will significantly affect the price you charge to your client:

    1. No. of pages to create
    2. No. of language
    3. Speed of the Web Server
    4. Capacity of the Web Server Storage
    5. No. of Functionality of the Website
    6. No. of customised programming code.
    7. Cost Domain Name
    8. 


    If we simply classify the “Website Building” to a single SKU, it definitely is not enough to cater all different needs from different clients in different scenarios. 

    How to design a quotation system which can quickly and accurately generate a quotation which covers all the requirements from the client, while at the same time having a short learning curve, is a world class challenge, not to mention most of the time the client doesn’t even know what he actually needs. (e.g. Do you think the client will proactively require you to install a DNS Caching system in order to speed up his website?)

    Besides, Service will always derive hidden cost of communication and cost of error. How to define a quantifiable and deliverable service is crucial for success. 

    The term “Service as a SKU” is the business model applied by Amazon Web Service (AWS), one of the biggest IT companies in the world, to eliminate the hidden costs derived by Service, by modularizing and quantifying all the services as much as possible via API. 

    In DDM, we will apply the same “Service as a SKU” model (as much as we can) . We can simply name all these SKUs a “Solution” in our Knowledge Monetization process.

    4. Interface

    After we have sold a particular Solution (continue to use the “Website Building” as the metaphor) to the client, we should consider how the Solution interfaces with both the Client , our Teammate , as well as other Computer Systems.

    Before we illustrate the concept with an real life example, allow me to enumerate and elaborate the Interface that we are going to cater:

    GUI – Graphical User Interface , which usually is easily and intuitively controlled by the end user (e.g. drag and drop). Most of the users will use the software via the GUI and didn’t even notice that they are using the GUI. The button you clicked to submit, or the drop down list you used to choose an option inside a software, are all examples of a GUI.  

    Source Code Interface – While most of the time the user can use the software by GUI , there is a scenario that the software allows the user (or the developer) to customise the software based on his specific need. Due to the fact that there are an infinite number of scenarios which can be requested by the user, it is impossible to in advance create all the GUI components to cater anyone for everything. And that’s the reason why the software will always provide a console which allows users to write their own programming code to alter the function of the software to fit their needs. We called this interface as “Source Code” interface

    CLI – Command Line Interface , which 99% of the time will not be touched by the end user. It should only be touched by the developer to place an order directly to the software without interacting with the GUI. CLI facilitates the developer to place an order in bulk hence the developer can automate the process. While the interface requires the developer to write Computer Command Line (e.g. type in copy C:/windows/abc.jpg to copy the file in the Windows Command Line Prompt), that’s the reason why it’s named Command Line Interface.

    Windows Command Line Prompt

    API – Application Program Interface, While all 3 above are talking about how the human (user / developer) is interacting with the software, the API is covering how to interact with one software (or system) to another software (or system). The “consumer” of the Interface is in fact the “Application Program” (i.e. the software), and that’s the reason why it named “Application Program Interface”

    To continue our Website Building metaphor , Imagine the client requested us to add a Captcha function in order to avoid the spam new user registration, you can think of the interface matrix as below:

    InterfaceParties involvedAction
    Website Frontend GUIWebsite VisitorTick the Recaptcha Checkbox
    Website Backend GUIWebsite DesignerTo change the Colour of the border of Checkbox of the Recaptcha
    To change the font size of the Checkbox of the Recaptcha 
    Source Code InterfaceDeveloperWrite a if-then-else scenario to control only non-logged in user should fill in the Recaptcha Box, while logged in user can skip this process
    CLIDeveloperWrite a scheduled program to periodically upgrade the version of the Recaptcha Plugin from the Vendor’s server.
    APIRecaptcha Vendor (e.g. Google Recaptcha) Charge the developer based on number of usage of the Recaptcha 

    While the client is referring to this “reCaptcha” function as “i’m not a robot box” , the Website Designer will tell the programmer this is a “Checkbox” with CSS ID = “google_recaptcha” . Meanwhile, the developer will name as an “Object” the recaptcha vendor will regard it as a “Recaptcha API Endpoint”

    Recaptcha Checkbox

    How to communicate among Client / Salesperson / Website Designer / Developer / Vendor will be a big challenge.

    Do you think the client will call the Salesperson and tell him that :

    “Hey guys, i want to write a if-then-else logic to block the spam registration from spam bot , i will call the API end-point 1000 times per month and to align the brand tone colour of my website , so please set the checkbox border-colour = rgb(242,129,123,0)”

    There is a huge demand for a lookup table to translate all the different jargons which are referring to the same thing among different people.

    That’s one of the duties of the bGraph.

    While the client is referring to this “reCaptcha” function as “i’m not a robot box” , the Website Designer will tell the programmer this is a “Checkbox” with CSS ID = “google_recaptcha” . Meanwhile, the developer will name as an “Object” the recaptcha vendor will regard it as a “Recaptcha API Endpoint”

    How to communicate among Client / Salesperson / Website Designer / Developer / Vendor will be a big challenge. 

    Do you think the client will call the Salesperson and tell him that : 

    “Hey guys, i want to write a if-then-else logic to block the spam registration from spam bot , i will call the API end-point 1000 times per month and to align the brand tone colour of my website , so please set the checkbox border-colour = rgb(242,129,123,0)”

    There is a huge demand for a lookup table to translate all the different jargons which are referring to the same thing among different people.
    That’s one of the duties of the bGraph


    Put everything of bGraph Together

    To bring what knowledge we (DDM)  acquired and turn it into a deliverable which can be sold to our client, this is what we called Knowledge Monetization Process.

    Below are the Knowledge Monetization Process examples we showcase some of the option values of each step inside the Process.

    (Step 1)
    Problem Pattern
    (Step 2)
    Thertocial Model
    (Step 3)
    SKUd
    (Step 4)
    Interface
    Avoid Spam

    CommentMembership

    System1st Purchase

    CouponSend Company

    Email
    OSI

    HTTP

    Javascript

    SMTP

    DNS
    Recaptcha Installation

    Membership System

    Installation

    SMTP Setup

    Coupon Code

    Setup Website UI Design

    Usage Training
    Frontend GUI

    Backend GUI

    Source Code Interface

    CLI

    API

    In real life all the Steps 1 to 3 in the Knowledge Monetization Process involve 1,000+ option values that we can choose for. 

    if we want to successfully sell the SKUd to the client based on the problem pattern he had raised out, we should choose 1 appropriate combination among all the combinations , which is 

    [Options Value Steps 1] x [Options Value Steps 2] x [Options Value Steps 3] x [Options Value Steps 4] x 

    4 x 5 x 6 x 5 = 600 combinations 

    We called these 600 combinations the (i.e. the result of that multiplication operation) Cartesian Product. These 600 combinations bring us a big question, how can we train up our Salesperson / Website Designer / Developer / Client to pick ONE appropriate combination among 600 so that the client can solve his problem? (don’t forget in real life all Step 1 to Step 3 have 1,000+ option values for each step, which in turn bring almost infinity numbers of combinations)

    For example, below is 15 of the combinations out of 600 which should deliver to the clients in order to solve his problem (i.e. Avoid Spam Comment)

    (Step 1)Problem Pattern(Step 2)Thertocial Model(Step 3)SKUd(Step 4)Interface
    Avoid Spam Comment
    JavascriptWebsite UI Design

    Recaptcha

    InstallationUsage Training
    Frontend GUI (Recaptcha Checkbox)

    Backend GUI (Colour of the Checkbox)

    Source Code Interface (if-then-else code to require only non-logged in user to tick the Recaptcha)

    CLI (auto update the version of the Plugin)

    API (Calculate the usage of the Recaptcha and hence charged by the vendor)

    How can our Salesperson know that he should pick up 3 SKUd (out of 6 in this example) to achieve the goal?

    How can our Developer know that he should tackle 5 interfaces to deliver the setting?

    How can our human resource manager know what knowledge the developer should know if he wants to recruit a developer to do the programming on the Recapthca installation process? (in this example, the developer needs to know how to write Javascript)

    This is a typical cartesian product data pattern that we will always face when we are acting as a business consultant. To cater this cartesian product data pattern is simply by building a database  to map all the option values in different steps.

    This is how a business consultant should act (assist anyone to choose , i.e. make a decision) , and then bGraph is (and going to be) a powerful system (i.e. the database with interface which can be used by users) which is acting as an automated consultant.


    In conclusion, bGraph is the foundation stone of our business , or even the definition of DDM.

    In bGraph it is : 

    1. Acting as a library , containing all the option values for each steps in Knowledge Monetization process
    1. Acting as a Graph Theory, which records every single relationship (we called it “edge”) among each “node” which are related to each other.
    1. With the automated business rules written inside the bGraph, acting as an automated business consultant to suggest the appropriate option value to the user in right time and right place.

    Thousands of hours can be saved in terms of all 5 costs mentioned above, and therefore we can scale up our business globally without any hiccup.