Abstract
Human learning is a complex and on-going process which describes the interaction between the human being and the environement surrounded them, and how they interpret the data and formulate the model to project the world. While it’s worth a whole book to explain it, in this article we only extract the part which related to the Data Structure.
Definition
Data
First of all, Data is nothing about computers or digital. long before the invention of computer or any digital devices, data exists.
Allow me to explain Data with an example. Some day 5,000 years ago in Mesopotamiaⓘ, a Sumerians named Adamen brought a sheep to the market for sale. While he stood in the street for almost 6 hours, finally he found a richman who was really going to buy his sheep for 50 Shekelsⓘ. He was happy and thought that if he could sell all the sheeps he possessed , which was 10 sheeps , he could have financial freedom. So he left the market and thought of how to execute his plan.
Immediately after he arrived home, he found it’s really hard for him to bring 10 sheeps from his home to the market. He was thinking that instead of bringing the entire sheeps to the market, is there any way that he can only bring part of the sheep? In turn, he cut off one nail from each of the sheep, and brought these 10 nails to the market to make people believe that he possessed 10 sheeps.
In this story, the nail of the sheep is acting as a Data to denote the underlying material object – the sheep.
You may wonder why he doesn’t simply use a paper and write the word “sheep” on it. Please bear in mind that paper and words were not invented at that time.
Of course, when time goes by, when the word and paper were invented, people like Adamen can simply use a paper to write down the wording “Sheep” to denote the underlying material object “Sheep”. No matter how , the function of Data, to point a word (or symbol , or glyphics, or character, or sound, or pronunciation, you name it.) to an underlying material object, is always the same.
That’s the beginning of the story of Data.
Data Structure
A data structure is a concept for running a database. Data structure is a specialised format for organising, processing, retrieving, and storing data. It defines how data is arranged in a computer so that it can be accessed and updated efficiently. There are mainly 2 types of Data Structures:
Relational
In common English for easy understanding, you can regard Relational Data Structure as a 2-Dimension table which use both Column and Row to co-ordinate a Value (i.e. we call it “Cell” in MS Excel or Google Spreadsheet). It mainly focus on the relationship between the attribute (i.e. the Column Name and Born) and the attaching object (i.e. the Table Ancient Celebrities) itself.
Example of a Relational Data Structure (i.e. a Table)
| Ancient Celebrities # | Name | Born in | Job Title |
|---|---|---|---|
| 201 | Plato | B.C 429 | Philosopher |
| 202 | Aristotle | B.C 322 | Philosopher & Mathematician |
| 203 | Alexander the Great | B.C 356 | King of Macedonia |
Non-relational
In common English, you can regard Non-relational Data Structure as a tree (or hierarchical) list which uses Node and Edge to coordinate the Value. Unlike Relational Data Structure which focus on the relationship between the attribute and it’s attaching object, Non-relational Data Structure focus on the relationship (i.e. the Edge) between Object (i.e. the Node) and another Object (i.e. another Node)
Example of a Non-relational Data Structure (i.e. a Tree List)
- Plato (Node 1)
- Aristotle (Node 2)
- Alexander the Great (Node 3)
Teacher – Student Tree List
whereas , there are 3 Nodes in the Tree List. Although it is tempting to think that there only 2 relationships (Edges) between the 3 Nodes, in fact there are 4 relationships (Edges) in among:
- Plato (Node 1) is the teacher of Aristotle (Node 2)
- Aristotle (Node 2) is the student of Plato (Node 1)
- Aristotle (Node 2) is the teacher of Alexander the Greate (Node 3)
- Alexander the Great (Node 3) is the student of Aristotle (Node 2)
4 Edges instead of 2 Edges because the direction of the relationship (Edge) does matter.
How Human Learn based on Data Structures
Let’s start this topic with a question asked from your friend:
Hey, who is Aristotle?
To answer this question, you may reply him in English as below:
Aristotle is ancient philosopher and mathematician who was born in B.C 322 , whom is the student of Plato as well as the teacher of Alexander the Great.
While the answer above is exactly same as what we will speak in daily English, this sentence is informative enough for anyone to have a brief understanding on who Artistotle is. Nevertheless, even though you are very good in English, compared with the time spent on reading the Table and Tree List , you may spend more time to read through the English sentence word by word.
On the contrary, while you are reading the sentence, in fact what you do to comprehend the sentence is by idetntifing the attributes of Aristotle (e.g. Born in , Job Title) , as well as the hierarchical relationship (i.e. Edges) between Plato (Node 1) and Alexander the Great (Node 3).
By presenting in Table and Tree List format, only with few hours of practice, anyone can comprehend any articles much faster than simply reading in plain English format.
Human Learning Behavior as an Adaptive Search
However, the story of human learning does not end just like this. Back to our example, while your friend seriously listened to your reply, although he realised that Aristotle is the student of Plato, you could never imagine he didn’t know the meaning of “B.C.” and he asked you about what is “B.C.”.
“B.C.” is an acronym of “Before Christ”. It is a dating system which is used to denote any year before the birth of Christ. The opposite of “B.C.” is “A.D.”, which stands for “Anno Domini”, which is a Latin phrase meaning “In the Year of Our Lord”. The year of 2024 means we are in A.D. 2024, which we normally will skip the terms “A.D.” as it is by default.
Having Replied by you, now your friend knew the new knowledge regarding the dating system B.C. and A.D. you can simply turn the plain English into the Table and Tree List format as if we have done before as below:
| Acronym | Word Stem | Language | Presenting Year |
|---|---|---|---|
| B.C | Before Christ | English | Before Christ Born at Year 0 |
| A.D | Anno Domini | Latin | After Christ Born at Year 0 |
- Dating System
- B.C.
- A.D.
Dating System Tree List
In fact, every single concept (I called it Knowledge Node) will always have its own attributes as well as the relationships (i.e. Edges) between other Nodes.
Imagine if your friend is a 5-year old boy and he knows very little about what you said (and even about this world!) and he is going to ask you almost every single word in your sentense like this:
- Who is Aristotle
- Who is Plato
- Who is Alexendar the Great
- What is B.C.
- What is A.D
- What is Latin
- Who is Christ
- What is Anno Domini
- What is Macedonia
- What is Philosopher
- What is Mathematician
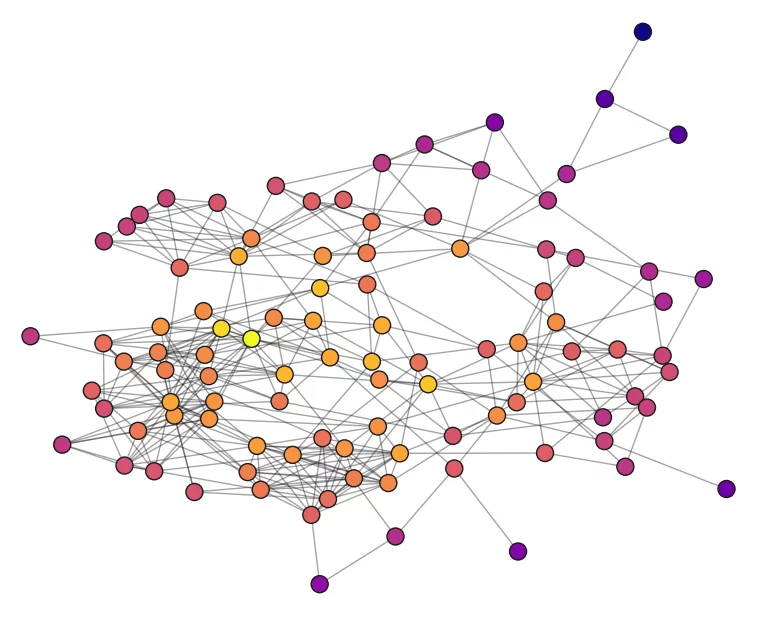
If you turn all these 11 concepts (i.e. Knowledge Nodes) into Table and Tree List format, you can imagine the Data Structure will resemble the image below:

This is a typical Adaptive Search pattern which someone need to “search for what he wants to search for“, and in turn forming a Knowledge Graph which a smart person like you will quickly realise that you can (or need) to add an infinite number of Nodes and Edges inside the Graph in order to learn something. The more Nodes you add into the diagram, the more attributes will be derived. And each attribute of a Node can become a new Node.
And that’s exactly how the data structure behaves during human learning.
Remember the previous example when you explain to your friend who Aristotle is. In order to make him understand who is Aristotle, he need to acquire the foundation knowledge which made him diving into 4 level of Nodes as below:
- Level 1 Node
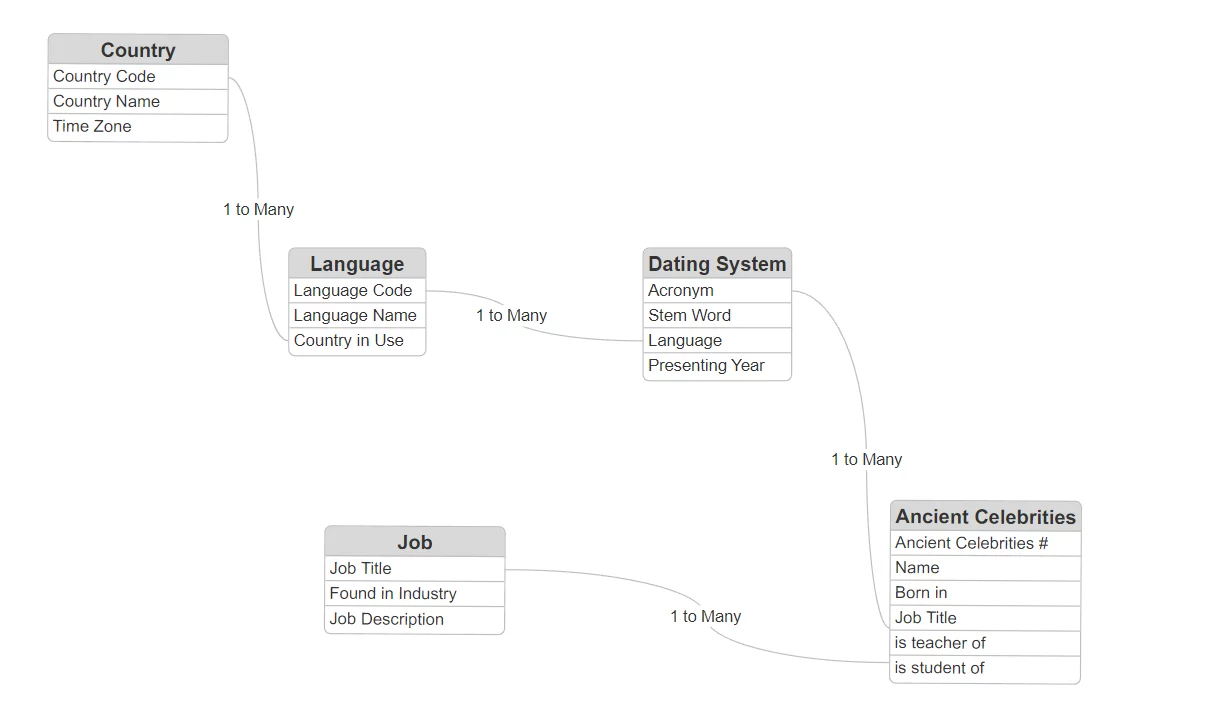
- Ancient Celebrities
- Level 2 Node
- Dating System
- Level 3 Node
- Language
- Job Title
- Level 4 Node
- Country
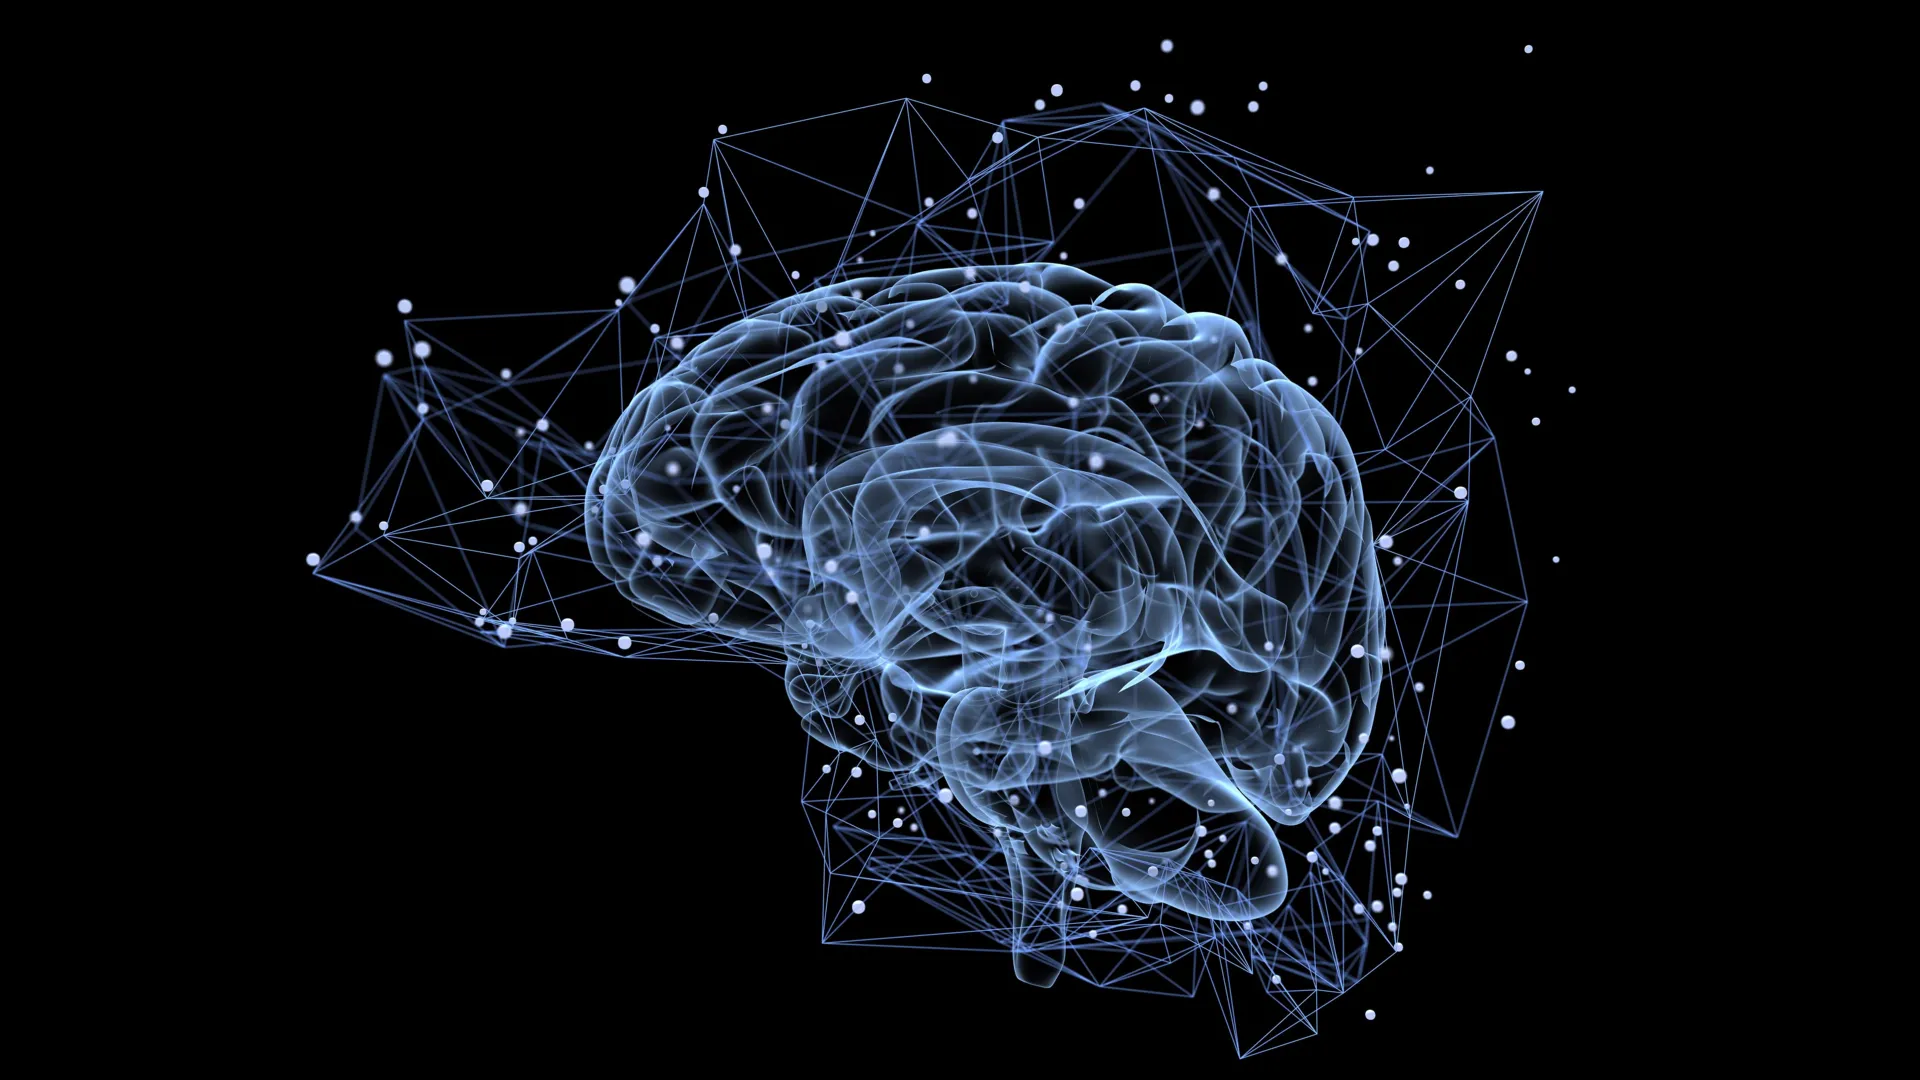
You can now sense the challenge of how a human being learns a new concept which he will get lost in the maze very soon after he has no idea how many levels he should dive into in order to comprehensively understand a single concept in a topic (i.e. a Knowledge Domain). And the Knowledge statedion in your brain will finally distribute in this way:

Nevertheless, don’t be upset by the truth and we should (and already have) found a “Map” to navigate us in this knowledge maze.
Finally , let’s back to Aristotle again and end this topic by an citation from him which describes the problem being suffered during human learning:
The More You Know , The More You Realize You Don’t Know
Memory- The Soul of Intelligence in a AI RAG Chatbot
Introduction In any AI RAG (Retrieval‑Augmented Generation) chatbot, memory is the true soul of intelligence. Without memory, the system is…
Multi Agent AI RAG Chatbot
Introduction An AI RAG (Retrieval‑Augmented Generation) chatbot becomes more powerful when built as a multi‑agent system. Instead of one generalist…
Retrieval Sources in AI RAG Chatbot
Introduction The “R” in “RAG” stands for the Retrieval process, which is the step where the system fetches relevant information…


Leave a Reply