Introduction
The objective of this article is to provide a blueprint which demonstrates and enumerates all the technical stacks used to build the bGraph.
Although using a Graph Database is a perfect tool to illustrate this kind of blueprint, ironically, we cannot use the Graph Database to demonstrate how to build a Graph Database because the Graph Database is not yet built.
Definition
bGraph
bGraph is a DDM terminology , which is assigned as the name of the Enterprise Knowledge Graph (EKG) built on top of Graph Database. You can regard the bGraph as a Knowledge Management System in DDM Group which consolidates all types of data , including Business Data, Meta Data and Model Data, into one place forming a supreme intelligence to answer any questions raised by either Clients or Staffs.
Architecture
Architecture of bGraph refers to all the technical stacks used to build the bGraph, as well as specific tools that we adapted for building the bGraph. You can regard it as a blueprint of the bGraph
Model Data
While there are many components which can be found in the bGraph Architecture, this article is focused on the component of Model Data. The best way to understand Model Data is to compare the Model Data with Meta Data and Business Data.
In the Database world, no matter what business it is running , Data can be classified as 3 categories :
Business Data
The data which reflect the business activities. For example, in an eshop a Watch is sold out to the Client named “Tony” with the price of USD$42, the “Tony” and “USD$42” will be regarded as the Business Data.
In an Excel File, you can regard the Column Name as the Model Data , while each record under the same column as Business Data. For example, If you have an Product Price List an Excel File as below:
| Product Type | Product Price (USD) |
|---|---|
| Watch | 42 |
| Shoe | 30 |
The Column Names Product Type and Product Price (USD) are regarded as Model Data, while the records [Watch,42] and [Shoe, 30] are regarded as Business Data.
Meta Data
It also means “Data of Data” , which the function of Meta Data is to describe the Model Data. With the same example, as an eshop webmaster, before you can sell the product in the eshop, you should have input the price of the product Watch in the Price Field in the backend of the Eshop. Instead of a Text String (i.e. US Dollar Forty-Two) in Data Type, you will expect the Price is filled in Number Format (i.e.42). In this case, the Numer (instead of Text String) is the MetaData which describes the Data Type of the Price field.
Model Data
In a relational table (e.g. a Sheet in Excel File), you can regard the Column Name (or a Field Name in an Form) itself as the Model Data , while each record under the same column as Business Data. For example, in Figure 1 – Product Price List in previous paragraph, The Column Names Product Type and Product Price (USD) is regarded as Model Data, while the record (i.e. the value of the cell) of [Watch,42] and [Shoe,30] are the Business Data.
It is imperative for us to differentiate the 3 categories of data due to the fact that different types of data are intertwined in our communication during the bGraph development cycle.
What Problem Patterns the Model Data Solves
Model Data can narrow the discrepancy between the Reality and Model in following aspects:
Avoid Duplicated description in the Data Model
It is very common to find both the CRM and an Accounting System in any scale of the companies, which means if you want to insert a new record of the First Name and Last Name of a Client, most likely that you have to record it twice in both the CRM and Accounting System.
While in reality the Client shows only once, in the Model it has shown twice in both CRM and Accounting System even though the 2 records in different systems are in fact referring to the same Client, meaning that the Model Data – First Name and Last Name of the Client, are duplicated.
This discrepancy between the Reality and Model lessens the fidelity of the Model.
Model Data is here to kill the discrepancy through duplication.
As an Simple View of Truth Under the DevOps business environment
In a traditional system development cycle, the Reality is being observed once in a particular time spot (most likely in a brain-storm sales meeting ) and this observation will be transformed to an Model, which most likely is presented by an Entity-Relationship Diagram, by the System Analyst.
However, soon or later this System Analyst realized that it is not the case. While in reality the business environment is ever changing, the observation to the Reality, as well as to Modeling the observation, become streaming tasks instead of batch tasks, meaning the observation and modeling tasks should be done continuously in agility, instead of only did once in the very beginning of the system development meeting. We called this concept as DevOps.
Let’s illustrate the example by the Table in below:
| Time Period | System Name | Properties (i.e. Field) |
|---|---|---|
| Year 1 | CRM (built in house) | Client.FirstName Client.LastName Client.Birthday (DDMMYYYY) |
| Year 2 | Accounting System (3rd party Saas) | Client.GivenName Client.FamilyName |
| Year 3 | Eshop (built in house) | Client.FirstName Client.FamilyName Client.Birthday (YYYYMMDD) |
In the infancy status (i.e. Year 1) of a startup company which you are working for, it makes sense to prioritise building a CRM system instead of an Accounting System in order to generate leads and sales revenue before complying with legal bookkeeping and auditing requirements. In a CRM system, your colleague Anna, as a system analyst, can easily observe from the reality that there should be the properties First Name and Last Name attached to a Client. The system analyst (Anna) therefore put the First Name and Last Name in our Model in below:
| First Name |
| Last Name |
It works perfectly until in Year 2, after there were quite a lot of sales orders made in Year 1, it is inevitable for the business to have an Accounting System to cater both the bookkeeping and invoicing tasks.
Due to the fact that the System Analyst , Anna, who built the CRM system in Year 1 had already quit, instead of inventing its own wheel, your boss in Year 2 decided to subscribe to a SaaS of a canned Accounting System, which has comprehensive functions catering all the bookkeeping and invoicing needs of the company.
Everything works fine until a fresh grad junior Sales Executive , Ann, who is instructed by you to find out a Client with ID# 302392 in CRM in the historical sales invoice report in the Accounting System. After Ann checked out the CRM through the ID# 302392 and the system showed the First Name and Last Name of the client as Joan Lee. Ann tried to put the First Name and Last Name Joan Lee to the Accounting System to generate the sales order report.
Unfortunately , after 60 minutes of effort, Ann failed to find out the fields First Name and Last Name to filter the sales order in the Accounting System , she requested help from her supervisor, which is you.
After you listened to the question raised by Ann, you are astonished that she did not even realize First Name is a synonym of Given Name and Last Name is a synonym of Family Name. (Please refer to Figure 2 – All System Development Timeline in previous paragraph)
Although you are frustrated , you still gently explain the truth to Ann, which took you another 15 minutes.
Therefore, all in all the company had spent 75 minutes on simply communication and education, which these communication and education costs will not be the last time to be incurred due to the fact that the new fresh grad employee which the company is going to hire in the future is very likely to encounter the same misconception.
Therefore, a centralized library which explain the relationships between any properties of any systems throughout the company is on demand.
The story did not end. With great difficulties the company still survived in Year 3 and would like to expand the business by running an Eshop online for overseas markets.
Your company hired another System Analyst , Joanna, to build the eshop which she had completed the project at lightning speed. After 100 new client registrations in the Eshop, when you want to import these 100 client registrations from the Eshop to the existing CRM, you finally realized that the field Birthday of the CRM is in format (i.e. the Meta Data) of DDMMYYYY , while in the Eshop the format is in YYYYMMDD.
Due to the fact that you realized all the Date related fields throughout the systems of your company are in YYYYMMDD, which is contradict with DDMMYYYY format usually used in your country, you have no choice but to request the newly hired System Analyst Joanna to spend another 1 months (i.e. 22 Working Days!) to turn all the Date related Fields in the Eshop from YYYYMMDD to DDMMYYYY in format.
By studying the example above, we realized that a centralized library (i.e. the repository) which stored all the Model Data (and its associated Metadata) will definitely help the System Analyst to avoid all the mistakes mentioned above by checking all the existing properties (i.e. the Model Data) of the existing systems in advance before the System Analyst started building any new system.
Fill in the gap between planning and execution
Following steps and role are played during the system development cycle:
| Time | Procedure | Role |
|---|---|---|
| Month 1 | Reality Observation | Salesperson End User Business Analyst Business Owner |
| Month 2 | Modeling | Business Analyst System Analyst |
| Month 3 | System Building Execution | System Analyst |
Consider the following scenario and timeline
Reality Observation
- In Month 1, End User feedback to the Salesperson that the CRM lacks of the
Salutationfield in theClientForm. - Salesperson passes this information to the Business Owner.
Modeling
- The Business Owner instructs the Business Analyst to see if the request is valid.
- In Month 2, The Business Analyst updated the System Blueprint (i.e. the Entity-Relationship Model) and passes the newly updated version to the System Analyst
System Building Exeuction
- In Month 3, the System Analyst studied the affected radius in the entire system and if which Forms and Reports will be affected. For example, the New Client Form , as well as the Lead Report may be needed to add the
SalutationField into them.
If you are detailed-mind enough, you may realize that , as a layman without any system analysis training background, the End User , Salesperson and Business Owner cannot technically and precisely turn their comment via Entity-Relationship Diagram friendly syntax to communicate with the Business Analyst.
Imagine what if all these 4 different parties involved in the communication chains are communicating by different language and wordings, how the fidelity of the reality has been deteriorated , and how much time is wasted on the redundant communication edge. (i.e. A to B , B to C , and C to D)
This means if the comment feedback from End User is not at the same time as the System Analyst to do the coding workload for updating the system , then this piece of comment from End User (i.e. comment on adding a new Salutation Field) should be recorded in somewhere and easily be found by the System Analyst in their system update request job queue.
The Model Data can act as a communication protocol during the whole system development cycle.
Avoid Duplicated Workload between Template and Instance
Model Data in Relational and Graph Database
Model Data in Traditional Relational Database
In a traditional way of building a CRM system, the Object Client may probably be described in the Entity-Relationship Diagrams in different systems as below:
| Column Name |
|---|
| First Name |
| Last Name |
| Salutation |
| Email Address |
When time goes by, another eDM System is introduced into the company with another Client Object inside the system as below:
| Column Name |
|---|
| Given Name |
| Family Name |
| Salutation |
| Gender |
Due to the fact that there are 2 separate systems, you cannot link up the 2 Client Tables of 2 systems in 1 Entity-Relationship Diagram. In fact, you have to draw 2 Entity-Relationship Diagrams, one system per Entity-Relationship Diagram.
This practice makes us can never realizes that in fact these 2 Client Objects in 2 separated systems are actually referring to same concept (i.e. Client) in the reality
Besides, if you find the field Gender is a valid and useful information in eDM, the system analyst may not address that this Gender field should also be added into the Client Table in the CRM system.
Model Data in Graph Database

On the contrary , if we demonstrate the Model Data via Graph created by Graph Database, we can enjoy the following benefit:
- Concept
Clientfrom CRM and eDM systems can be consolidated and presented in 1 Node. This consolidation can easily be figured out by the Node Labels (i.e. the wording eDM and CRM outside the Node circle) - One can easily find out the relationship of properties from 2 separate systems. For example, the graph explicitly shows that the
Given Namein eDM is in fact identical to theFirst Namein CRM by reading the Relationship Type (i.e.IDENTICAL_TO) - While the property
Genderis a useful information which should define (and have defined) in eDM, it makes sense to infer that thisGenderproperty should also be defined in CRM. By using Graph Data Science AI tools, this kind of insight (we called it Label Prediction) can easily be achieved. While the AI algo is out of the scope of this article, we will discuss it somewhere in the future. - In the future, as the business grows, you will realize clients can be classified as Individual Client and Organisation Client, which only Individual Client has the properties of First Name and Last Name (so on and so forth). You can easily modify the relationships among nodes by writing a simple GraphQL Statement.
Limitation of Model Data via Graph Database
Although modeling data with a Graph Database provides greater fidelity, the Graph Database in itself is not good for data input.
While in our daily life most of the Input Form and Report are linked to underlying Tables in a Relational Database, it is hard for us to build the Input Form and Report directly on top of a Graph Database. Although it is technically feasible to do so, due to the compatibility with other existing systems, as well as the human user behavior in both inputting and consuming data, the technical stacks will strike a balance between user experience and Model Fidelity.
In this sense, we decide to keep the Relational Database as an “Abstract Layer” between the Frontend Application (during Input) by both human / machine (i.e. API) users and the Graph Database.
The toughest trade-off of this method is that we need to periodically synchronise , either in mutual (2-way) or in 1-way , the data between the Relational Database and Graph Database, although it’s still manageable .
Technical Stacks of the Model Data
- Node Table
Create a Table name “bNode” in Relational Database to store (as records in a Table) all the Nodes.
This Node Table can also serve as a LookUp Data List as if traditional Relational Database does. For example, as the Option List of Gender {Male | Female | Trangender | Unisex} will always be the same no matter under which system or knowledge domain, there is no need to define the Option List of the property Gender for each system (or each instance of a system type). This Option List of property Gender can be looked up by different systems via their Gender Field, this is nothing about Graph Database which already serves the purpose perfectly.
- Relationship Table
Create a Table name bRelationship in Relational Database to store (as records in a Table) all the relationships among the Node.
Example Record in a Relationship Table:
| Source Node | Relationship Type | Target Node |
|---|---|---|
| Client | HAS_ONE | First Name |
| Client | HAS_MANY | Email Address |
| First Name | IDENTICAL_TO | Given Name |
- Importing both Node and Relationship Tables in the Graph Database, whereas:
- Use the feature of Graph Database – Node Label , to classify which Knowledge Domain (a.ka. Namespace or Context) the Node is under. In the CRM example, the Node First Name is under the Knowledge Domain (i.e. Namespace) of CRM, and therefore you can find the Label outside the Node First Name in Figure 3 – Data Model By Graph.
- While there are many ways to import the data from a Relational Table into the Graph Database, we will apply the following ways under different scenario:
- By Cyber – Lollipop Model
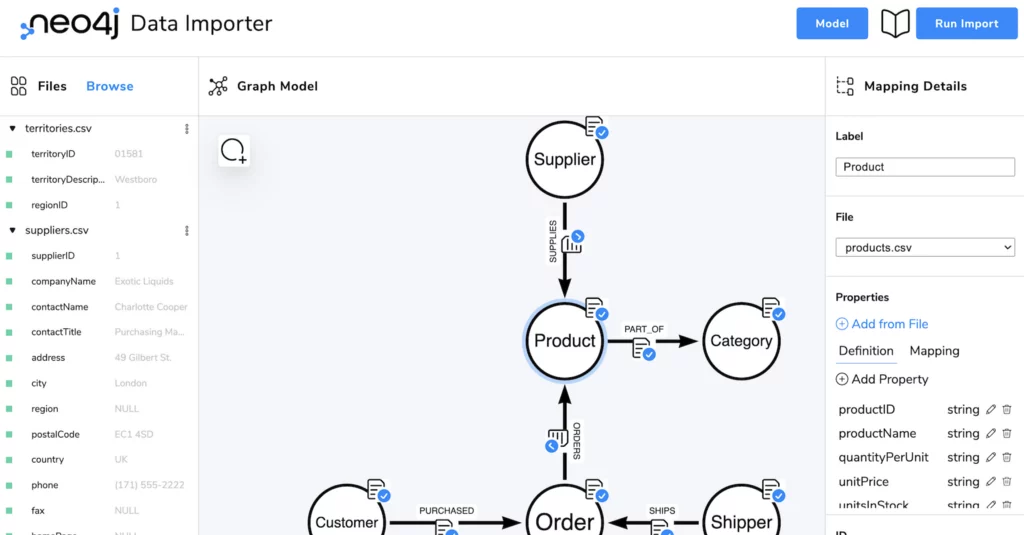
- By Data Importer GUI – Sunflower Model
- Synchronize (either 1-way or 2-way) between Relational Database and Graph Database under CRUD events.
- Allow Read/Write with different views (a.k.a Prospective) by End Users via GUI in Graph Database by coding (e.g. Cypher)
- Allow the User to Read/Write with different view (a.k.a Prospective) by End Users via GUI in Graph Database semantically by plain English. (or other Language) via Semantic Search Engine.1
Footnotes
- This will be performed by LLM Algo which is out of the scope of this article. ↩︎
Leave a Reply