Category: Knowledge Base
-
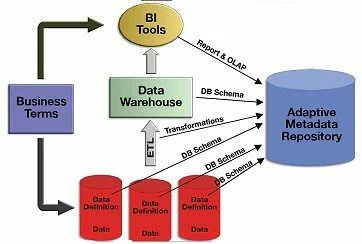
What is Metadata Repository
Definition Metadata Repository is a centralized database which stored all the metadata (i.e schema) of all other system or database within an organisation. You can regard it as the library of metadata of metadata in an organisation What Problem Pattern the Metadata Repository Solves Duplicated Schema definition in different system Imagine a scenario when an…
-

Assign Shopify Collaborator Access Rights
Prerequisite Step By Step As an Shopify Store Owner or Admin As an Collaborator (Assignee) Permssions Status will be Access pending until the Shopify Store Owner accept the request.
-
Checking Existing Google Tracking Code in a Website
Definition Google Tracking Code is referring to any kinds of tracking code snippet which is published under Google Digital Asset’s umbrella. Google Digital Assets with tracking code snippet normally covers the Google Analytics, Google Tag Manager, Google Ads and Google Marketing Platform. What Problem Patterns it solve Avoid duplication Digital Assets creation Due to the…
-
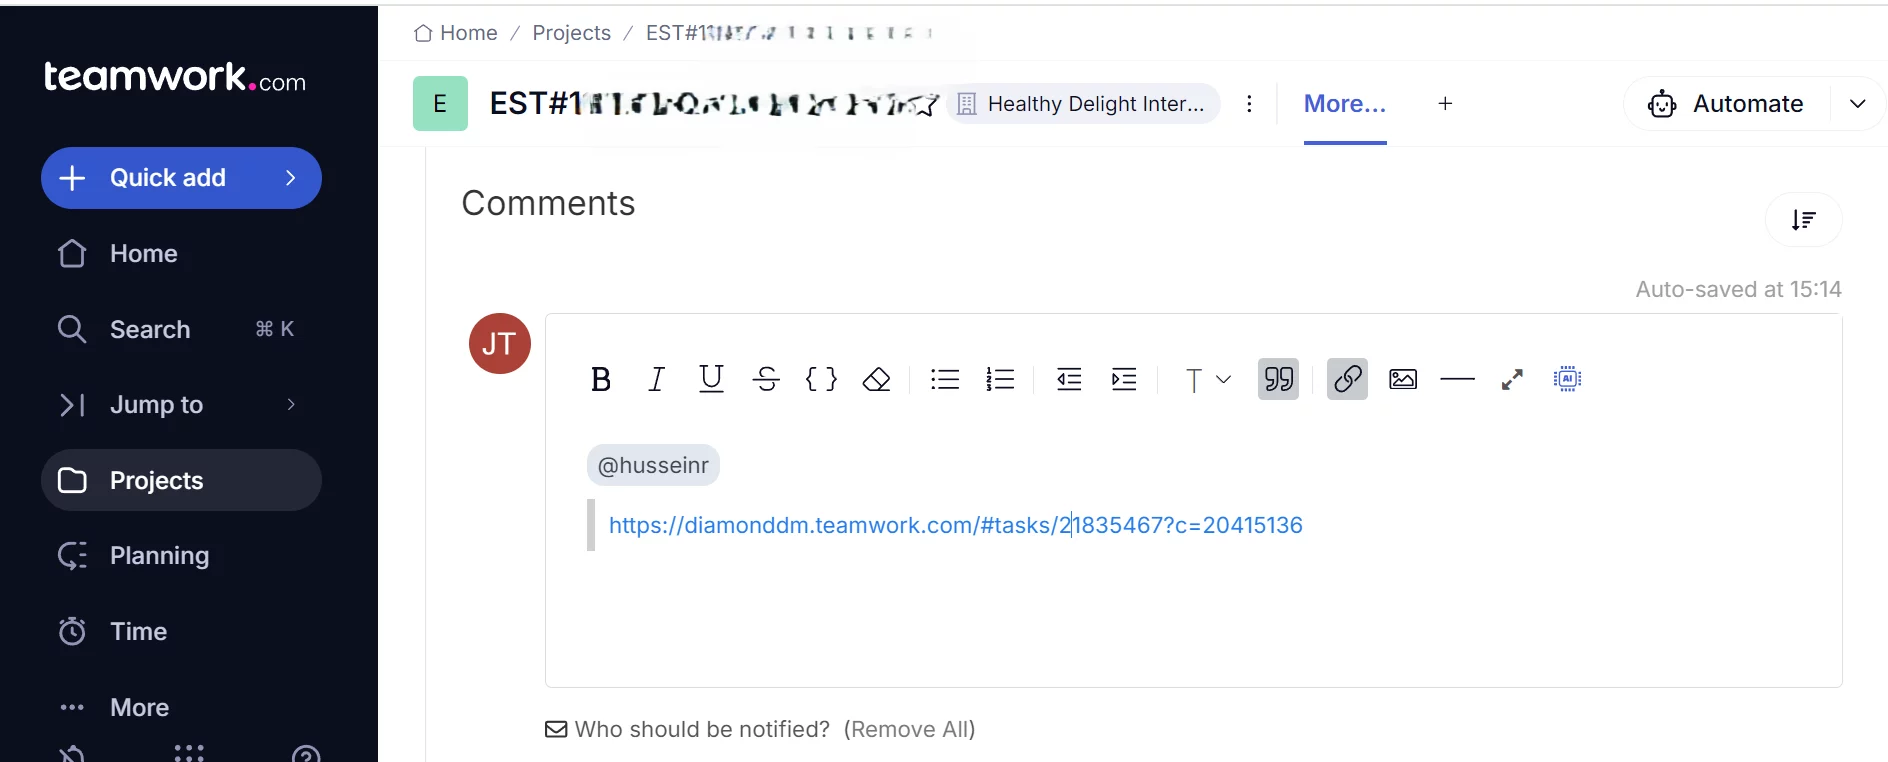
How to Comment in Teamwork.com
Definition Comment in Teamwork.com can be used to response any Task , SubTask or Milestone by either assignee (i.e. collaborator) or the assignor (i.e. Project Manager) of the Task. How Comment in Teamwork.com looks like What Problem Patterns the Comment solved Accessability Not only can you use the Teamwork.com interface to place the comment, but…
-

Inviting Collaborator to Join Project Management System
Definition Project Management System In DDM Group, we will adapt teamwork.com as the Project Management System, which is used by tens of thousands of orangisation in the world. Whom to Invite Administrator Supervisors or Project Managers in DDM Group will be invited as Administrator. Standard User Any non Administrator teammates but own an domain email…
-
Access Rights – DDM Github Profile
Definition Github GitHub is a web based platform that provides hosting for software development and version control using Git. It’s widely used for code collaboration, allowing developers to work together on projects, track changes, and manage different versions of their code. GitHub also offers features like project management, code review, and issue tracking, making it…
-

Assign Google Analytics 4 Access Rights to Others
About Google Analytics 4 (GA4) Google Analytics 4 (“GA4”) is a tracking and measurement tools provided by Google freely to the public. In this article, we will mainly focus on how to assign access rights to others who manage the GA4 on behalf of you. When to assign Access Rights to others Keep secret to…
-
What is a Pivot Table
Introduction Pivot Table is a feature which you can usually see in the Google Spreadsheet and Microsoft Excel. While alots of people can address it existence, seldom people can explain what it is and what it’s difference between the normal table. In this article, we are going to break it down and elaborate it in…