Category: Business Process Management System
-
What is a Pivot Table
Introduction Pivot Table is a feature which you can usually see in the Google Spreadsheet and Microsoft Excel. While alots of people can address it existence, seldom people can explain what it is and what it’s difference between the normal table. In this article, we are going to break it down and elaborate it in…
-
Bingo! Theory
Introduction When you search in the internet, although there is many other theory with the same name , Bingo! Theory (remarks : the “!” does matter) is a terminology which is invented by Diamond Digital Marketing to explain the priority of a project go vertically or horizontally. What is Bingo in real life Bingo is…
-

Build a Business Process Management System – BFs-WAITER Pivot Table
Introduction Recap from the article Build a Business Process Management System – Stage of System Building that the MSC Matrix (Modelling – Standardisation – Coding) describing different stages of building a system. In this article, we dive into how we observe the real world to do the Modelling by using the BFs–WAITER Pivot Table. Definition…
-
Build a Business Process Management System – System Index Concepts
Definition What is Business Process Management System Business Process Management System is the system which you want to standardize and automate literally any business procedures happened in your business routine. While some of the Business Process Management System, for example , a CRM System (Customer Relationship Management) is mature and well modularized which you can…
-
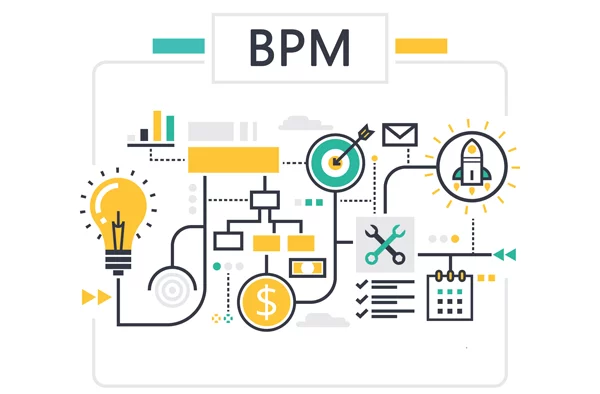
What is Business Process Management System (BPM)
Definition A Business Process Management System (BPMS) is a platform (normally a SaaS) that manages and automates well-defined business processes. It creates an infrastructure that enhances company agility, making work faster and easier. BPM involves modeling, automation, execution, control, measurement, and optimization of business activity flows to support enterprise goals across systems, employees, customers, and…