Category: bGraph
-
Data Schema of Relational Table Importing to Graph Database – Execution
Introduction In the earlier article titled Data Schema of Relational Table Importing to Graph Database – Dimensionality, we explored how to observe real-world data and transform it into a digitised format within a Relational Database. The greater the dimensions we account for, the higher the fidelity with which the Relational Database represents reality. In this…
-
Data Schema of Relational Table Importing to Graph Database – Dimensionality
Definition Relational Table The Table is the fundamental components inside a Relational Database which stores data in tabular format using Column and Row to coordinate a specific Value (i.e. the Cell). Form and Table (i.e. Tabular format) are everywhere in your daily life. Data Schema in Relational Database A data schema in a Relational Database…
-

What Problem Patterns bGraph Is Going to Solve
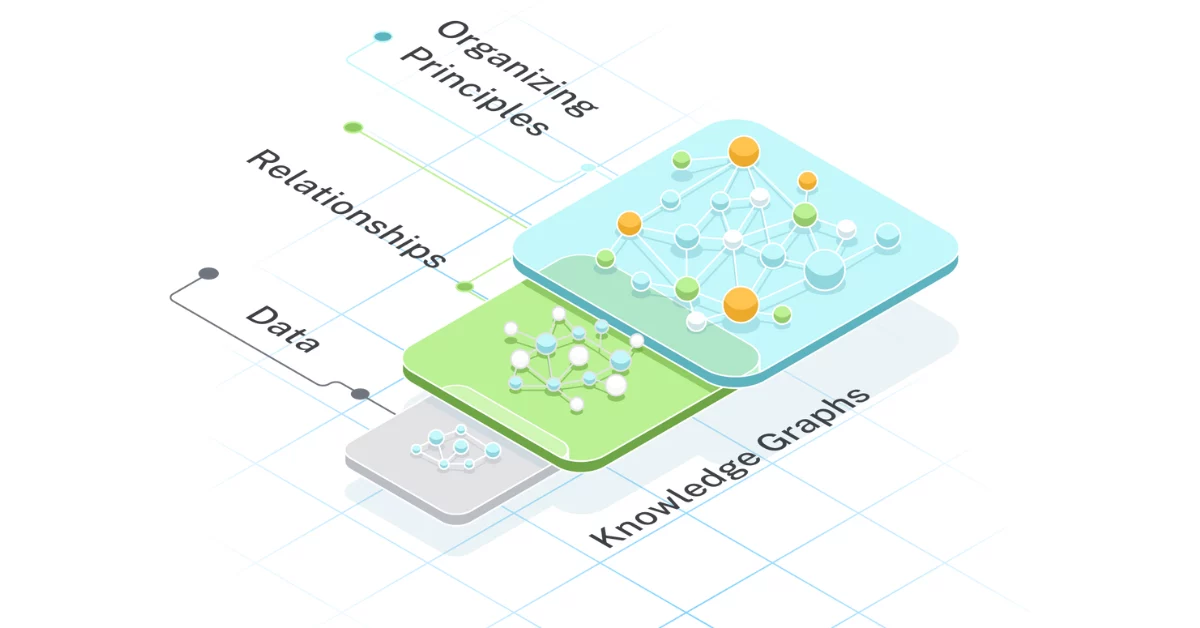
Introduction bGraph is an SaaS developed in-house by Diamond Digital Marketing Group which can be categorised as a GraphRAG web application serving as an Enterprise Knowledge Graph. To better understand what GraphRAG exactly is, it is imperative for us to start with a real world problem pattern Real World Problem Patterns The definition of profit…
-
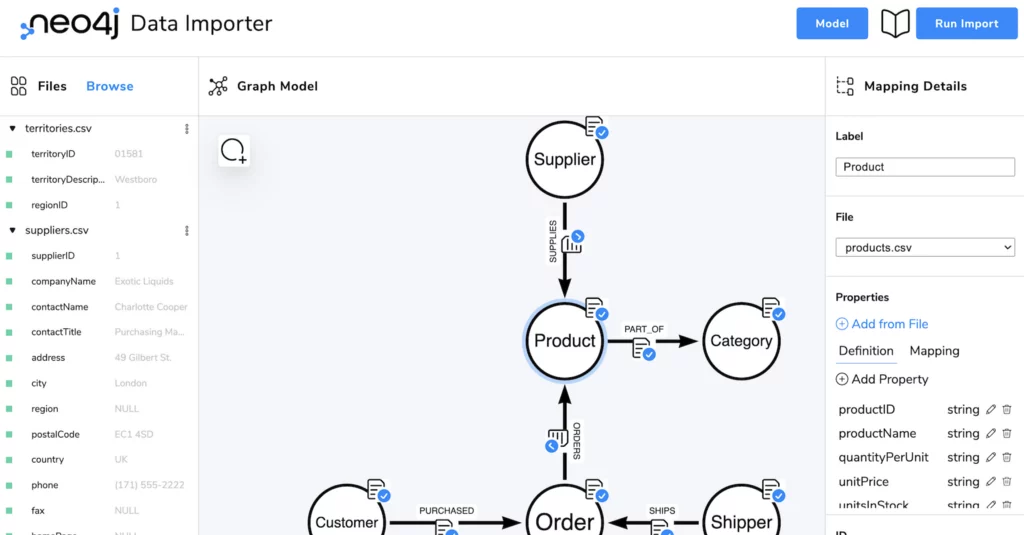
bGraph Architecture – Model Data
Introduction The objective of this article is to provide a blueprint which demonstrates and enumerates all the technical stacks used to build the bGraph. Although using a Graph Database is a perfect tool to illustrate this kind of blueprint, ironically, we cannot use the Graph Database to demonstrate how to build a Graph Database because…
-
bGraph for Business Process Management
Introduction While in article Build a Business Process Management System – Stage of System Building we have defined that the 1st stage of building a system is Modeling, in article Build a Business Process Management System – BFs-WAITER Pivot Table we have further named the content or directions that we should included in the Modeling…
-
What is Metadata Repository
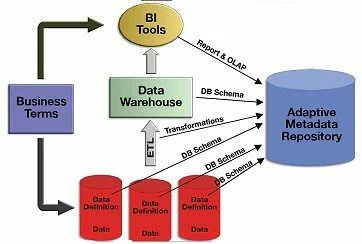
Definition Metadata Repository is a centralized database which stored all the metadata (i.e schema) of all other system or database within an organisation. You can regard it as the library of metadata of metadata in an organisation What Problem Pattern the Metadata Repository Solves Duplicated Schema definition in different system Imagine a scenario when an…
-
Marketing Nerual Networking Model
Definition A Neural Network Model, also known as an artificial neural network (ANN), is a type of machine learning model inspired by the structure and function of the human brain. While this model is applied in the Marketing domain, it becomes the Marketing Neural Networking Model. Instead of diving into the intricacy of the mathematical…
-
Relationship between Human Learning and Data Structure
Abstract Human learning is a complex and on-going process which describes the interaction between the human being and the environement surrounded them, and how they interpret the data and formulate the model to project the world. While it’s worth a whole book to explain it, in this article we only extract the part which related…